Democratic socialism—thereby fusing populist authorization with bureaucratic command—inverts civil society’s logic: spontaneous coordination yields to electoral control, property, and precedent to administrative discretion. The quest for legibility breeds discretion, opacity, colonizing associations, and politicizing provision. The polity grows more ceremonially majoritarian as its structure turns illiberal. Human relations become increasingly politicized. The space for autonomous and dissenting freedom steadily recedes—Vibhu Vikramaditya
In this issue:
When Free Lunch Politics Meets Fiscal Reality: Lessons from the DPWH Flood Control Scandal
I. Selective Framing: The "Smallest Deficit" Headline
II. Bigger Picture: Weak
Revenues, Sluggish Spending, Cumulative Deficit Near Record Highs
III. Quietly Moving the
Goalposts, Budget Gaps: Enacted vs. Revised
IV. Interventionist
Mindset: The Root of the Fiscal Imbalance
V. The Economics of
"Free Lunch" Politics: The Law of Scarcity Meets the Welfare State
VI. Debt Dynamics and the
Savings–Investment Gap
VII Corruption as Symptom,
Not Cause
VIII. Public Spending at
Historic Highs and the DPWH Flood Control Scandal
IX. The DPWH Scandal: A Systemic Threat
X. A Policy Dilemma: The Impossible Choice
When Free Lunch Politics Meets Fiscal Reality: Lessons from the DPWH Flood Control Scandal
What the DPWH scandal reveals about the fragility of a spending‑driven political economic order
I. Selective Framing: The "Smallest Deficit" Headline
Inquirer.net, August 29, 2025: A modest increase in government spending narrowed the Philippines’ budget deficit in July to its smallest level in nearly five years, keeping the shortfall within the Marcos administration’s target. The state continued to spend more than it collected after recording a fiscal deficit of P18.9 billion, albeit smaller by 34.42 percent compared with a year ago, latest data from the Bureau of the Treasury showed.

Figure 1
The July budget deficit headline—“smallest in nearly five years”—is a textbook case of selective framing.
While technically accurate, it obscures deeper fiscal concerns by exploiting the optics of quarterly VAT reporting, which front-loads revenue at the start of each quarter. Since 2023, firms have filed VAT returns quarterly instead of monthly, so revenues at the start of each quarter appear inflated, producing artificial “surpluses” or unusually slim deficits. (as discussed last year, see reference) [Figure 1, upper image]
This makes July look exceptional, but it is little more than a timing quirk—not a sign of genuine fiscal improvement.
II. Bigger Picture: Weak Revenues, Sluggish Spending, Cumulative Deficit Near Record Highs
In reality, the cumulative January–July shortfall has ballooned to Php 784.4 billion, the second-largest on record. [Figure 1, lower chart]
Revenues grew by only 3.26% while expenditures posted a meager 1.02% increase. The Bureau of the Treasury itself attributed the spending slowdown to the "timing of big-ticket disbursements of the Department of Public Works and Highways, Department of Social Welfare and Development, and Department of National Defense for their respective banner programs."
Year-to-July, expenditures are up 8.2%, slower than 13.2% in 2024, but the bigger story lies in revenue weakness: collections grew just 4.8% this year compared with 14.75% in 2024. The 24.9% contraction in non-tax intake and the sharp deceleration in Bureau of Customs growth (1.5% vs. 5.8% in 2024) dragged overall revenues down.
III. Quietly Moving the Goalposts, Budget Gaps: Enacted vs. Revised
July’s Php 491.2 billion in expenditures also fell sharply below the Php 561 billion monthly average needed to meet the Php 6.326 trillion enacted budget.

Figure 2
Compounding this, the Bureau of the Treasury reported that 2025 fiscal targets had been revised downward (by the DBCC) for both revenue and spending, now pegged at Php 6.08 trillion. [Figure 2, upper table]
Authorities attributed the adjustment to "heightened global uncertainties," but the subtext is clear: the government is quietly recalibrating expectations to preserve its 5.5% deficit ceiling, even as structural weaknesses deepen. The headline may offer comfort, but the underlying trajectory points to fragility, not fiscal strength.
The enacted budget sets the ceiling—what government aims to spend—while the revised budget marks the floor, revealing what it can realistically afford as conditions shift.
Yet the jury is still out on whether the current administration will break its six-year trend of exceeding the enacted budget—or whether this implicit admission of slower growth will instead spur even more spending in the second half of the year.
IV. Interventionist Mindset: The Root of the Fiscal Imbalance
Of course, the fiscal imbalance is merely a symptom.
As previously discussed, it is driven by behavioral factors—such as the heuristics of recency bias and overconfidence—combined with an overreliance on a technocratic bureaucracy fixated on flawed econometrics as the fountainhead of interventions. (see reference on our previous post dealing with the rising risks of a Fiscal Shock)
Most importantly, it is fueled by a populace increasingly dependent on social democracy’s "free lunch" politics, anchored in a deepening interventionist mindset.
As Mises Institute’s Joshua Mawhorter lucidly describes, "by living under a modern, highly interventionist modern nation-state, the default paradigm of political elites and the general public is that, whenever a problem arises, the government must do something, that not doing something would be irresponsible and disastrous, that it can only help, and that the worst possible option would be doing nothing. This might be called the interventionist mindset or interventionist paradigm." (bold added)
V. The Economics of "Free Lunch" Politics: The Law of Scarcity Meets the Welfare State
This mindset lays the policy framework for trickle-down Keynesian spending programs financed by the BSP’s easy money.
Public spending on an ever-widening scope of social services—including the proposed "universal healthcare" for all Filipinos—illustrates this. [Figure 2, lower left image]
In simple terms, while such programs may appear ideal, the law of scarcity dictates that there must be sufficient savings to sustain a welfare state.
If the rate of redistribution exceeds the growth of savings, funding must come from elsewhere—either by borrowing from future taxpayers or through the inflation tax, via financial repression and fiscal dominance enabled and facilitated by central bank accommodation.
Yet a persistent reliance on borrowing or inflation is not sustainable. Both are subject to ‘reversion to the mean’ and will eventually face a reckoning through crisis.
VI. Debt Dynamics and the Savings–Investment Gap
The thing is, while some authorities acknowledge the burden of public debt—"every Filipino now owes P142,000"—most attribute it to "corruption," a convenient strawman. [Figure 2, lower right picture]

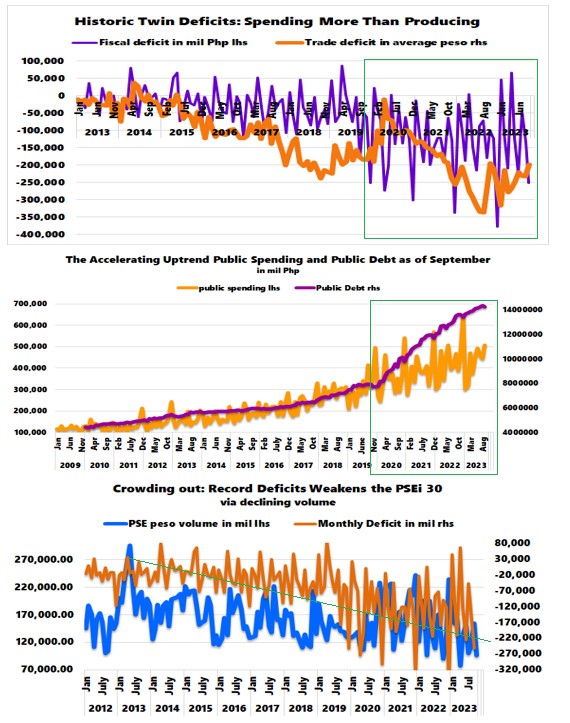
Figure 3
Alongside rising expenditures, public debt surged to a record Php 17.56 trillion last July, sustaining its upward trajectory and accelerating in both scale and velocity! MoM changes depict this uptrend. [Figure 3, topmost and center graphs]
All told, the Philippines suffers from a record savings–investment gap, which hit a new high in Q2 2025. [Figure 3, lowest chart]
But "savings" in national accounts is a residual GDP-derived figure that is deeply flawed; it even includes government "savings" such as retained surpluses and depreciation, when in reality, the fiscal deficit reflects dissaving (as discussed during CMEPA last July; see reference).
With public debt up Php 296.2 billion month-on-month, Php 1.873 trillion year-on-year, and Php 1.512 trillion year-to-date, the government is suggesting a forthcoming decline in public debt by the end of 2025.
Technically, while a ‘slowdown’ may occur, this is a red herring—it omits the fact that soaring deficit spending inevitably translates into higher debt, higher inflation, or both.
VII Corruption as Symptom, Not Cause
Social democrats fail to heed the lessons of EDSA I and EDSA II: corruption is a legacy of big government.
What is often forgotten is that corruption is not the disease but a symptom of vote-buying politics—of a system built on free-lunch populism, where political spending buys loyalty, entrenches dependence, transfers wealth, consumes savings, and simultaneously erodes institutions through ever-deepening interventions.
Per the great Frédéric Bastiat,
"When plunder has become a way of life for a group of men living together in society, they create for themselves in the course of time a legal system that authorizes it and a moral code that glorifies it." (Bastiat, 1848)
Still, social democrats cling to the illusion that electing an "angel" leader can deliver an ideal command-and-control economy. They overlook that forced redistribution—or legalized plunder—breeds societal tensions and unintended consequences, triggering a vicious cycle of interventions and power concentration —exactly what Tocqueville warned against when he said absolute power corrupts absolutely.
Again, Bastiat reminds us:
"legal plunder may be exercised in an infinite multitude of ways. Hence come an infinite multitude of plans for organization; tariffs, protection, perquisites, gratuities, encouragements, progressive taxation, free public education, right to work, right to profit, right to wages, right to assistance, right to instruments of labor, gratuity of credit, etc., etc. And it is all these plans, taken as a whole, with what they have in common, legal plunder, that takes the name of socialism." (Bastiat, 1850)
The bigger the government, the greater the corruption.
VIII. Public Spending
at Historic Highs and the DPWH Flood Control Scandal

Figure 4
Today, public spending as a share of GDP is at its highest level (!!) compared to pre-EDSA I and pre-EDSA II—and that’s counting only direct public expenditures, excluding construction and private sector participation in government projects such as PPPs and other ancillary ventures. [Figure 4, upper diagram]
From this perspective, the ongoing flood control scandal is merely the tip of the iceberg, with contractors and select authorities in the “hot chair” serving as convenient fall guys for a much larger, systemic issue.
IX. The DPWH Scandal: A Systemic Threat
These X.com headlines provide a stark clue as to how public spending and GDP might be affected: [Figure 4, lower images]
- DPWH, DBM set 2-week deadline to review DPWH budget
- Palace says review of DPWH’s 2026 budget could expand to other agencies
- DPWH Secretary Vince Dizon suspends bidding for locally funded projects amid massive corruption scandal
The unfolding DPWH scandal threatens more than reputational damage—it risks triggering a contractionary spiral that could expose the fragility of the Philippine top-down heavy economic development model.
With Php 1.033 trillion allotted to DPWH alone (16.3% of the 2025 budget)—which was lowered to Php 900 billion (14.2% of total budget)—and Php 1.507 trillion for infrastructure overall (23.8% and estimated 5.2% of the GDP), any slowdown in disbursements could reverberate across sectors.
Many large firms are structurally tied to public projects, and the economy’s current momentum leans heavily on credit-fueled activity rather than organic productivity.
Curtailing infrastructure outlays, even temporarily, risks puncturing GDP optics and exposing the private sector’s underlying weakness.
Or if infrastructure spending is curtailed or delayed, growth slows and tax revenues fall—VAT, corporate, and income tax collections all weaken when economic activity contracts.
This means the deficit doesn’t necessarily shrink despite spending restraint; the “fiscal hole” may, in fact, widen—imperiling fiscal stability and setting the stage for a potential fiscal shock.
The irony is stark: efforts to contain corruption by tightening spending could deepen the very gap they aim to close.
To be clear, this is not a defense of corruption but rather a reminder of how dependent GDP growth has become on public spending, leaving it vulnerable to the vagaries of political oscillation—including the ongoing flood control corruption scandal.
X. A Policy Dilemma: The Impossible Choice

Figure 5
With debt servicing already absorbing a growing share of the budget (7-month interest payment accounted for 14.8% share of expenditure), and revenue buoyancy dependent on infra-led growth, the administration faces a dilemma—either sustain spending through a compromised political pipeline or risk a broader economic and fiscal unraveling.
The lesson is, the real danger lies not in the scandal itself, but in the systemic exposure it threatens to reveal:
- A growth model overly reliant on state-led spending
- A fiscal framework vulnerable to both political shocks and bureaucratic paralysis
- A debt trajectory that leaves little room for error when revenues falter
In short, the interventionist mindset at the core of social democracy’s "free lunch" political economy entrenches structural fragility, as shown by the mounting fiscal imbalance.
The DPWH scandal crystallizes a deeper tension—forcing the political economy to weigh popular demands for ‘good governance’ against the imperatives of a development model structurally reliant on public spending.
As Roman historian Tacitus warned (The Annals of Imperial Rome):
"The more corrupt the state, the more numerous the laws."
____
Vibhu Vikramaditya How Democratic Socialism Inverts the Logic of Civil Society Mises.org, September 3, 2025
Prudent Investor Newsletter, Philippine Government’s July Deficit "Narrowed" from Changes in VAT Reporting Schedule, Raised USD 2.5 Billion Plus $500 Million Climate Financing September 1, 2024 Substack
Prudent Investor Newsletter, June 2025 Deficit: A Countdown to Fiscal Shock, August 3, 2025 Substack
Joshua Mawhorter Interventionist Non-Interventionism Mises.org, September 5, 2025
Prudent Investor Newsletter, The CMEPA Delusion: How Fallacious Arguments Conceal the Risk of Systemic Blowback, July 27, 2025 Substack
Frédéric Bastiat Economic sophisms, 2nd series (1848), ch. 1 Physiology of plunder ("Sophismes économiques", 2ème série (1848), chap. 1 "Physiologie de la spoliation"). Econolib
Frédéric Bastiat, The Law (1850), Ludwig von Mises Institute 2007 Mises.org