The market prices bring supply and demand into congruence and determine the direction and extent of production. It is from the market that the capitalist economy receives its sense. If the function of the market as regulator of production is always thwarted by economic policies in so far as the latter try to determine prices, wages, and interest rates instead of letting the market determine them, then a crisis will surely develop—Ludwig von Mises
In this issue
Philippine November 2023 CPI Plunged to 4.1%, T-Bill Rates Fell Further, Steepened the Treasury Curve as the BSP Downplayed Rate Cuts
I. The Treasury Markets versus the BSP: The 2022 Rate Hikes
II. The Treasury Markets versus the BSP: The BSP’s Shifting Goal Posts and Credit and Liquidity Drive Inflation
III. T-Bill Rates Dive Further after the November 4.1% CPI Print
IV. BSP’s Ambivalence is a Reflection of its Conflicting Policies
V. November’s Broad-Based CPI Decline; Second Countercyclical Phase of the Inflation Cycle; Excess Volatility Confirmed the Cyclical Downturn
VI. Relative Strong Peso, Weak Oil Prices Helped Eased the CPI; Redux: the BSP is about to Ease Soonest
Philippine November 2023 CPI Plunged to 4.1%, T-Bill Rates Fell Further, Steepened the Treasury Curve as the BSP Downplayed Rate Cuts
Philippine November CPI plummeted to 4.1%. Departing from the BSP 'hawkish' rhetoric, T-bills plunged, and the Treasury Curve steepened. Who will be right: the market or the monetary bureaucracy?
I. The Treasury Markets versus the BSP: The 2022 Rate Hikes
Does the Treasury Markets influence the interest rate policies of the BSP?
Before the BSP went into its historic rate hikes in 2022, the following news quotes should give us a clue. (bold highlights mine)
Inquirer.net, March 18, 2022: The Bangko Sentral ng Pilipinas (BSP) does not have to raise its policy rates just because the US Federal Reserve did, as such decisions will depend on the domestic situation, BSP Governor Benjamin Diokno reiterated on Thursday. Diokno was reacting to a question about whether the BSP will follow the US Fed, which in effort to slow down inflation raised the benchmark federal fund rate by 25 basis points to 0.5 percent
Inquirer.net, March 23, 2022: The Bangko Sentral ng Pilipinas (BSP) intends to keep key rates low even as it expressed concern that the ripple effects of the conflict between Russia and Ukraine would reach the Philippines’ financial system.
ABS-CBN News, April 5, 2022: Bangko Sentral ng Pilipinas Governor Benjamin Diokno on Tuesday said the central bank is "prepared" to take action to keep inflation expectations in check. The BSP in March kept the key borrowing rate at 2 percent. However, recent data suggests that inflation could remain elevated in the coming months, Diokno said during Tuesday's Philippine Economic Briefing.
Inquirer.net, April 27,2022: The Monetary Board (MB) may consider raising its key policy rate in June if the Philippine economy grew by 6 percent to 7 percent in the first quarter, according to MB chair and Bangko Sentral ng Pilipinas (BSP) Governor Benjamin Diokno.
ABS-CBN News, May 18, 2022: A day before the Bangko Sentral ng Pilipinas decides on whether to adjust or hold interest rates steady, the head of the central bank hinted that it was getting harder to keep rates low. The BSP Monetary Board is set to meet again on Thursday. It has kept the policy rate at a historic low of 2 percent since November 2020 to prop up the pandemic-battered economy.

Figure 1
Like today, the BSP continued to move its goalpost. First, it foresaw its first hike in 2H 2022, then moved it to June 2022, citing the GDP. [Figure 1, upper chart]
Next, it argued against the impact of the Fed rate increases, which, unlike today, has been used as a reason to keep rates at a multi-decade high.
Altogether, in the preference to "keep rates low," the BSP had deep misgivings or had been reluctant about rate increases.
Yet, the BSP abruptly commenced its "baptism of fire" of rate hikes on May 19, 2022.
Though inflation moored the BSP's actions, the Philippine Treasury markets projected its rise.
T-bill rates ascended even as the BSP dithered in public over its proposed shift in policy stance. After the first salvo, T-bill rates rose faster, forcing the BSP to respond with rapid increases.
The Philippine curve steepened sharply through June 2022 to broadcast the coming inflation storm with about a one-year time lag.
Subsequently, the flattening slope presaged the concurrent disinflation wave from a build-up of excess capacity on top of the monetary tightening. We used the spread of the 10- and 1-year yield as a barometer of the curve. [Figure 1, lower graph]
In the meantime, the same treasury benchmarks, represented by the yield spread and T-bill rates, coincided with the 2018 rate cuts and the historic bottom of 2020.
Be that as it may, the treasury markets directed the hands of the BSP than popularly perceived.
II. The Treasury Markets versus the BSP: The BSP’s Shifting Goal Posts and Credit and Liquidity Drive Inflation
Fast forward to 2023.
Last July, the BSP initially proposed to cut rates when the CPI would fall into its target range of 2-4%.
GMA News, July 6, 2023: The Bangko Sentral ng Pilipinas’ (BSP) policy-setting Monetary Board is likely to consider cutting interest rates within the year if inflation rate falls to 4%, the central bank’s new governor, Eli Remolona, said.
The BSP continued to shift its channel signaling to the public from dovish to hawkish to neutral back to hawkish.
Interestingly, last week, the BSP resisted the notion of rate cuts.
Businessworld, December 8 2023: BANGKO SENTRAL ng Pilipinas (BSP) Governor Eli M. Remolona, Jr. said it is premature to discuss policy easing in 2024, with the Monetary Board still prepared to hike borrowing costs if needed to make sure inflation returns to the 2-4% target range…Mr. Remolona said the BSP remains hawkish as frequent supply shocks could lead to higher inflation expectations and second-round effects.
How logically incoherent. How does raising interest rates (a demand management tool) curb a "supply-side" driven inflation?
Inflation expectations and second-round effects? An unfettered pricing system resolves supply-side inflation. As an economic aphorism goes, the best cure for high prices is high prices. Remember the law of demand?
In this plane, with fixed money, increased demand for some goods will result in lower demand for others. So, how should this create a "general price increase" unless supported by an increase in money?
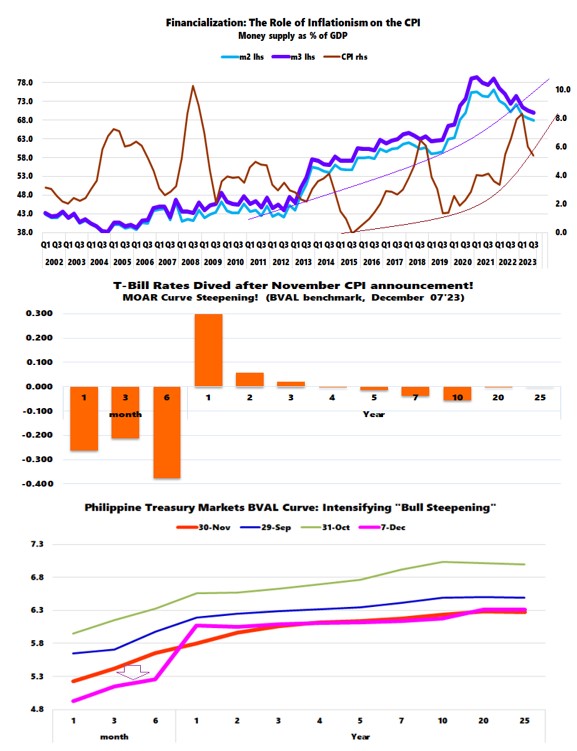
Figure 2
Therefore, "too much money chasing too few goods" results in higher inflation expectations through lower demand for the money (the peso) in favor of goods and services. Why hold onto a currency that has been eroding its purchasing power?
As evidence, the BSP's money supply as a % share of the GDP surged from 2013 onwards and rocketed to HISTORIC levels (68% M2 & 70% M3 in Q3), principally from the BSP's record Php 2.2 trillion liquidity injections in 2020-21. [Figure 2, topmost diagram]
In two years, the CPI peaked. How is this supply side driven? Or, the relationship between the uptrend in the money supply-to-GDP (since 2013) and the present inflation cycle has barely been a coincidence but a causal one.
The data also reveals that credit and liquidity activities rather than productivity have driven the GDP, rendering the economy vulnerable to inflation and boom-bust cycles.
III. T-Bill Rates Dive Further after the November 4.1% CPI Print
Circling back to the Treasury markets and the BSP.
When the BSP raised the possibility of cuts last July, T-Bill rates remained rangebound and even rose ahead of the October hike to 6.5%.
Surprisingly, since mid-November 2023, T-bill rates have melted down.
Though not a "surprise," the 4.1% November CPI "beat" the consensus estimates (4.3% Reuters). It nestled at the lower spectrum of the BSP's target of 4.8% to 4%.
But instead of steadying, T-bill rates fell even more after the CPI announcement this week. Figure 2, middle window]
Since the rest of the curve was at a standstill (little changed), the plunge in T-Bill rates magnified the "bullish steepening"—a harbinger of rate cuts! [Figure 2, lowest chart]
Treasury markets may have dismissed the CPI number as an understatement or see further weakness in the coming months for it to pressure the BSP to respond with rate cuts!
Sure. The BSP may stall in 2023 and defer the cuts to early 2024.
However, as long as the yield curve steepens from the softening T-bill rates, this will BSP prompt the eventual easing moves—as economic strains surface.
And once the BSP does ease, a further steepening of the curve implies a comeback of inflation over time.
IV. BSP’s Ambivalence is a Reflection of its Conflicting Policies
The BSP's ambiguous policy stance is partly a result of its asymmetric and conflicting policies.

Figure 3
Sure, policy rates are at multi-year heights, but credit card subsidies have powered consumer demand, even as industry loan growth has stumbled.
Though the record streak of credit card debt levels (in peso) continued in October, its blistering growth rate seems to have peaked, fluctuating 29% to 30% YoY throughout 2023. [Figure 3, top and middle windows]
Further, banks continue to finance the modest increases in fiscal (deficit) spending, resulting in a rebound in the money supply. M3 rose from 6.8% in August to 7.9% in September 2023. [Figure 3, lowest graph]
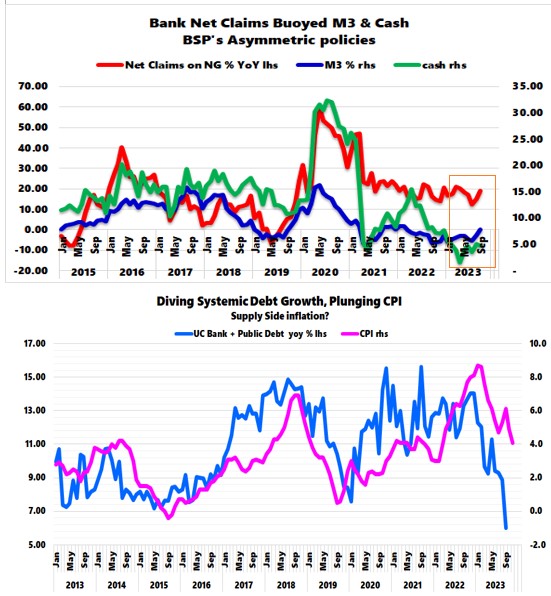
Figure 4
Meanwhile, the banking system's net claims on the central government (NCoCG) surged by 19.25% to a record Php 4.8 trillion in September. [Figure 4, upper chart]
Notwithstanding, the general slowdown in systemic liquidity (public debt plus universal commercial bank loans) has weighed on the CPI. Systemic debt growth eased from 8.9% in August to 6.03% in September. [Figure 4, lower graph]
So, the BSP appears to be banking on the sustained and relentless rise of consumer credit and bank financing of deficit spending for its "hawkish" policy stance in the face of worsening liquidity strains.
Here is the thing. The BSP seems to be making its policies up as things unfold, or they have a negligible handle on the present developments.
V. November’s Broad-Based CPI Decline; Second Countercyclical Phase of the Inflation Cycle; Excess Volatility Confirmed the Cyclical Downturn
The November CPI downturn was broad-based.

Figure 5
Though food weighed the most on the index, 7 of the 13 components were down YoY, while 12 of 13 fell month-on-month. The transport and the Food segments fell the most MoM. [Figure 5, topmost chart]
For this reason, the headline CPI posted a more substantial drop from 4.9% in October to 4.1% in November than the Core CPI, which slipped from 5.3% to 4.7% over the same period.
In any case, the uptrend of the 2015 inflation cycle remains intact, or the current disinflation represents a countercyclical phase. [Figure 5, middle pane]
Aside from having predicted its peak last March, another indicator has confirmed the disinflation dynamic.
Each time the Month-on-Month volatility of the CPI soared past 1%, it marked an inflection point. September’s 1.4% volatility sealed the fate of the present downturn of the inflation cycle, which climaxed with January 2023's record monthly 1.7% volatility—previously discussed here. [Figure 5, lowest graph]
VI. Relative Strong Peso, Weak Oil Prices Helped Eased the CPI; Redux: the BSP is about to Ease Soonest

Figure 6
The relatively strong peso (from a generally weak US dollar) added to the CPI’s decline. [Figure 6, topmost graph]
As for "imported inflation," falling international oil prices, which represent the emaciating demand for oil amidst disunion between OPEC and other oil producers, have also contributed to the downside pressure on the CPI. [Figure 6, middle chart]
By and large, the sharp plunge of the Headline and Core CPI represents the weakening of the Nominal GDP amidst a multi-year high in the BSP's rates.
Using the expanded data, the scale and speed of the headline and CORE CPI decline resonated with the Great Recession of 2008-2009, when the BSP went on a panic-cutting spree.[Figure 6, lowest window]
Although the treasury markets have acknowledged this, the BSP remains seemingly confused about its supposed "data-driven" policy actions.
As noted earlier, contra the consensus and the BSP's recent declarations, unless actions in the T-bill markets reverse, we accede with the Treasury Market's position: the BSP's rate cuts are coming soon! Much sooner than everyone thinks.
Our bet is on the markets over politics.


