Showing posts with label Japan economy. Show all posts

Monday, November 16, 2015

The Magic of Abenomics: Japan Enters Recession: Five Recessions in Eight Years! Two Under PM Abe!

In 2014 I wrote that Abenomics will hardly bring about a recovery:
It’s a wonder how the Japanese economy can function normally when the government destabilizes money and consequently the pricing system, and equally undermines the economic calculation or the business climate with massive interventions such as 60% increase in sales tax from 5-8% (yes the government plans to double this by the end of the year to 10%), and never ending fiscal stimulus which again will extrapolate to higher taxes.

The mainstream has all been desperately scrambling to look for “green shoots” via statistics. They fail to realize that by obstructing the business and household outlook via manifold and widespread price manipulations, this will only lead to not to real growth but to greater uncertainty which translates to high volatility and bigger risks for a Black Swan event.
There's been no black swan yet, but greater uncertainty has indeed been unfolding.

Despite cumulative monetary and fiscal stimulus, Japan's economy as measured by their statistical GDP contracted for two successive quarters once again. This means Japan has fallen into a recession 

From Bloomberg: (bold added)
Japan’s economy contracted in the third quarter on sluggish business investment, confirming what many economists had predicted: The nation fell into its second recession since Prime Minister Shinzo Abe took office in December 2012. Gross domestic product declined an annualized 0.8 percent in the three months ended Sept. 30, following a revised 0.7 drop in the second quarter, the Cabinet Office said Monday in Tokyo. Economists had estimated a 0.2 percent decline for the third quarter.

Weakness in business investment and shrinking inventories contributed to the contraction amid concerns over slower growth in China and the global economy that prompted Japanese companies to hold back on spending and production. While growth is expected to pick up in the current quarter, the GDP report could put pressure on Abe and Bank of Japan Governor Haruhiko Kuroda to boost fiscal and monetary stimulus. The BOJ holds a policy meeting later this week...

Businesses in the third quarter reduced investment, in a rebuff to Abe’s call for Japanese companies to put more of their record cash holdings into capital spending. From the previous quarter, business investment fell 1.3 percent in the July-September period, following a revised 1.2 percent contraction, according to the report.
A milestone FIFTH recession in 8 years! And second recession in PM Shinzo Abe's tenure! What a legacy!


Zero Hedge provides the 'Quintuple Dip' chart...


But recessions are really good news for stocks! 

That's because the BoJ will be expected to pour more of the same stuff that has plagued its economy!
 

Tuesday, April 28, 2015

Wow. Japan’s Retail Sales Collapse 9.7% (Y-o-Y)!

What has Abenomics delivered to her real economy?

From Bloomberg: (bold mine)
Japan’s retail sales fell in March the most since 1998, cutting against central bank chief Haruhiko Kuroda’s view that cheaper energy will give a boost to the world’s third-biggest economy.

Sales dropped 9.7 percent from a year earlier, when there was a run-up in purchases ahead of an April sales-tax increase, according to trade ministry data released Tuesday. Sales sank 1.9 percent from the previous month, compared with a gain of 0.6 percent forecast by economists in a Bloomberg survey.


Sorry but cheap energy will hardly give a boost to the economy. This represents merely a shift in spending patterns as earlier explained here. Income growth is what really drives consumer spending growth. Although transient spending boosters can emerge from credit expansion or from depletion of savings, the latter two are unsustainable.

As I wrote in June 2014
It’s a wonder how the Japanese economy can function normally when the government destabilizes money and consequently the pricing system, and equally undermines the economic calculation or the business climate with massive interventions such as 60% increase in sales tax from 5-8% (yes the government plans to double this by the end of the year to 10%), and never ending fiscal stimulus which again will extrapolate to higher taxes.

The mainstream has all been desperately scrambling to look for “green shoots” via statistics. They fail to realize that by obstructing the business and household outlook via manifold and widespread price manipulations, this will only lead to not to real growth but to greater uncertainty which translates to high volatility and bigger risks for a Black Swan event.
No worry. Crashing retail sales means HIGHER stocks!

Thursday, February 19, 2015

Japan’s January Trade Balance: What You See Depends On Where You Stand

Below is an example of how statistics can be used to confuse or mislead the audience/reader.

Japan’s January external trade conditions, according to Nikkei Asia:
Japan's trade deficit shrank 57.9 percent in January from a year before to 1,177.5 billion yen ($9.91 billion), as exports to the United States and China jumped while imports slid with crude oil prices diving worldwide, government data showed Thursday.


The report is accurate when compared to the previous January data. But that’s because the January 2014 data looked like a statistical outlier (see red rectangle) where the deficits swelled more than the seeming normal distribution rate.

On the other hand, Japan’s January trade deficit has been at the worst level since April 2014 as shown by the chart from Investing.com

The deficit has also been bigger on a month on month basis.

Next the basis of trade balance…

Exports
The value of exports surged 17.0 percent to 6,144.7 billion yen, up for the fifth straight month, as those of automobiles and semiconductor components grew, the Finance Ministry said in a preliminary report.


The year on year figures represents a fact. (chart from investing.com)

But again that would be just part of the story.


In nominal terms, exports collapsed in January of last year (2014) as shown by the red ovals in the chart from Tradingeconomics.com

Said differently, the January 2015 basis of comparison emanates from last year's very low level of exports.

And the January 2014 export data has signified the statistical fat tail that led to outsized trade deficits of the same period, which has been the basis of comparison for January 2015. Media makes no mention of this.

So when compared to 2014's low level, current export growth would naturally project G-R-O-W-T-H.

Yet in nominal terms, January exports have only been at July 2014 levels (green horizontal line). Hardly any meaningful improvement. 

On a month on month basis, exports even slumped—down by 10.9%!

What you see depends on where you stand.

More…

Imports
Imports dropped 9.0 percent to 7,322.2 billion yen after an upturn in the previous month, with those of fossil fuels for thermal power generation -- which has made up for the absence of nuclear power following the 2011 Fukushima nuclear crisis -- falling, the ministry said.


That’s the year on year change of Japan’s imports as reported by media…(chart from investing.com)


But this can’t be seen as an accurate representation of Japan’s trade conditions.

That's because the story radically changes when seen from the nominal levels where import trend appears headed upwards with intermittent monthly volatility. (chart from tradingeconomics.com)

Despite crumbling in oil prices in the last quarter of 2014, Japan’s imports seem to have been trending higher. Over the short term, imports have been up since May 2014. Over the longer term, import trend has been on the rise since July 2013

Although month month has shown a modest 3.1% decline.

Again everything depends on the basis of comparison.

The bottom line: What media tries to spin as “positive” also have negative aspects when seen from different angles. Nonetheless the focus on a single set of statistics ensures that the audience remain blind to the alternatives.

For the unaware, spins like this help abet reckless asset pump and push. So the Nikkei now trades at fresh 8 year highs (foreign buying 113.9 billion yen as of February 7), even as JGBs remain skittish amidst foreign buying (435.2 billion yen as of February).

Monday, February 16, 2015

Japan 4Q 2.2% GDP: Another Government Statistical Pump

According to the establishment the Japanese economy has shed the recession garb

…but for how long?

From the Nikkei Asia:
The Japanese economy expanded an annualized real 2.2 percent in the three months to December, marking the first growth in three quarters, the government said Monday.

The growth in October-December inflation-adjusted gross domestic product -- the total value of goods and services produced at home -- corresponds to a 0.6 percent increase from the previous quarter and compares with an average market forecast of 3.86 percent annualized growth.

In the fourth quarter, private consumption, accounting for around 60 percent of Japan's GDP, rose a real 0.3 percent, supported by sales of mobile phones and personal computers, an official of the Cabinet Office said.

Corporate capital spending, which the government sees as key to shoring up the economy, gained 0.1 percent following a 0.1 percent decrease in the July-September period.
The Japanese government seems to have three measures in looking at the GDP


image
The above represents the headline data or the quarterly growth annualized.
image

The above represents the non-annualized quarter growth

The two numbers reveals a lift of Japan’s economy out of a recession.
image

This is the GDP annual growth rate. Seen from the annual growth, Japan remains in a recession

So two stories from three different statistics. But the establishment goes to report the data that fits its agenda

Yet whatever the data used, in my opinion 4Q performance has merely been a bounce that represents a temporary anesthetic effect from BoJ’s QE 2.0

image

The reason: Private investments have been lackluster in the 4Q even when seen from the lens of the headline statistics as sourced from Japan’s Cabinet Office.

image

Yet the “surge” in consumption may have most likely been a response to the yen’s dramatic devaluation in  4Q. The yen lost 7.6% over the same period!

So this may be another frontloading of expenditures in the face of severe price disturbances in the system.

Additionally, 4Q GDP has more been about government really. Public investments made a substantial contribution to the growth statistics.

Mediocre investment activities, consumption boost from BoJ’s devaluation, and a big boost from government spending means Japan’s 4Q GDP represents no less than a government statistical pump—or growth only in statistics.

If the recession’s influence has been to spike the stock market, what more a statistical pump by the government. So the Nikkei hits the 18,000 an eight year. Pumping and pushing of asset markets based on mirages. But the real economy struggles.

Thursday, January 15, 2015

The Two Faces of Japan’s November Machinery Order Report

The mainstream sees the November Japanese Machinery Order report as  “positive”

For instance, this CNBC headline says “Japan November core machinery orders rise 1.3% on month” (bold mine)
Japan's core machinery orders rose a smaller-than-expected 1.3 percent in November from the previous month, government data showed on Thursday, suggesting capital expenditure among manufacturers could weaken.

The rise in core orders, which exclude those of ships and electric power utilities, compared with a 5.0 percent rise forecast by economists in a Reuters poll. It followed a 6.4 percent decline in October, the Cabinet Office data showed.

Compared with a year earlier, core orders, a highly volatile data series regarded as an indicator of capital spending in the coming six to nine months, fell 14.6 percent, against the median estimate of a 5.8 percent annual decline. The Cabinet Office lowered its assessment of machinery orders, saying the recovery is showing signs of stalling.

image

Japan’s Machinery Order based on Tradingeconomics.com charts

On the other hand the Zero Hedge reports a big slump on the same report: (bold original)
So much for that short-lived hope-fest that Abenomics was not a total and utter disaster. Japan Machinery Orders (excluding -rather ironically- volatile orders) plunged 14.6% Year-over-Year in November (missing expectations of a 6.3% drop) for the biggest fall since Nov 2009

image

What’s the difference? The framing.

Both looks at the same report but the point of emphasis differs. 

The mainstream sees the ‘positive’ the month on month change. On the other hand, the Zero hedge accentuates on the ‘negative’ or the year on year change.

What you see depends on where you stand.

But observe that in the mainstream report above, the 14.6% plunge in core orders was also reported, except that this has been buried in the third paragraph 

image

Yet here is the official data and report from Japan’s Cabinet  office: (bold mine)
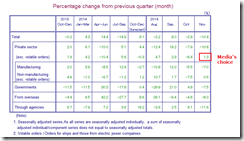
-The total value of machinery orders received by 280 manufacturers operating in Japan decreased by 10.4% in November from the previous month on a seasonally adjusted basis.

-Private-sector machinery orders, excluding volatile ones for ships and those from electric power companies, increased a seasonally adjusted by 1.3% in November.
image
image

Notice of the omission of the total value of machinery orders? 

Yet Japan’s Cabinet office illustrated the collapsing total value of machinery orders, as well as, the private sector segment of the machinery orders statistics.


Wednesday, December 17, 2014

Relentless Run in GCC’s Stock Markets and in Russian Financial Assets! Japan Import Growth Shrinks as Exports Slow

Last night, European crude benchmark Brent resumed its hemorrhage and was down 1.96% while the US counterpart the WTIC bounced .18%

And the incredible stampede out of GCC stock markets continues…

image
(table from ASMAinfo.com)

Last night too, Saudi’s Tadawul and Dubai Financial crashed by another 7.27%. Qatar, Muscat and the Kuwait slumped by 3.51%, 2.92% and 2.08% respectively. All these adds to Sunday December 15th crash!

Once record high stocks is being dismantled at an astounding speed and stupefying rate of decline. The obverse side of every mania is a crash.

Oh by the way, Western banks have reportedly cut cash flows to Russian banks, as the Zero Hedge noted “FX brokers advised clients that any existing Ruble positions would be forcibly closed out because "western banks have stopped pricing USDRUB", over concerns of Russian capital controls.”

The article further quotes the Wall Street Journal "global banks are curtailing the flow of cash to Russian entities, a response to the ruble’s sharpest selloff since the 1998 financial crisis."

image

So along with plummeting oil prices and economic sanctions, the liquidity squeeze exacerbates the stunning run on Russian financial instruments. At the rate of the evolving Russian financial market turmoil, the odds of a default has been soaring as revealed by the skyrocketing CDS or the cost to insure debt as shown in the chart above.

“Curtailing the flow of cash” reveals how global liquidity is being drained. If risk assets are about liquidity, credit and confidence that the latter two generates, then the shriveling liquidity flows poses as increased structural headwinds on risk assets. If sustained then  asset inflation will turn into asset deflation.

My final note

Last November, Japan export growth year on year has underperformed consensus expectations despite the crashing yen.

image

The USD-Yen has been up by  14.7% since the BoJ GPIF bailout of the stockmarket

image

Export growth fell by 4.9% and has been in a decline since November.

This is another evidence which debunks the popular mercantilist “weak currency-strong export” myth peddled by the consensus.

image

Also Japan’s import growth has collapsed again. It has CONTRACTED by 1.7% over the same period. The slump in imports reflects the demand conditions in the Japanese economy.

This represents the "wonders" of Abenomics--doing the same thing over and over again and expecting different results.

Additionally, Japan's imports are someone else’s exports. Japan represents the largest export market for the Philippines as of 2013. Contracting imports means marginal growth or even zero or reduced exports for the Philippines to Japan!

As I noted last weekend,
...one nation’s imports signify as some other nation’s exports. As noted above, Chinese import growth contracted in November (y-o-y), Germany’s import growth rate also CONTRACTED 3.1% month on month in October. For the Philippine bulls who sees virtually no risks, but all glory from credit fueled levitated assets, how will collapsing Chinese and German demand for imports, affect domestic exports? Do they know? In 2013, exports to China ranked third of Philippine exports with 12.4% share and Germany ranked sixth with a 4.1% share. Signs are already here, Philippine export growth rate collapsed to 2.9% in October from the stellar over 10% growth rate during the past four months, specifically 15.7% in September, 10.5% in August, 12.4% in July and 21.3% in June. Add these to the collapsing markets of the GCC, which places OFW remittances at risk. So where will demand come from? Domestic demand has already been constrained by credit overdose as revealed by investments on a downtrend, and by growth in credit and statistical economy that has been moving in opposite directions, and by consumers harassed by BSP’s invisible redistribution favoring the political and economic elites. So where will Philippine statistical growth come from? Statistical massaging? Or manna from heaven?
The world economy has been deteriorating, liquidity has been shrinking, yet domestic bulls are expecting G-R-O-W-T-H!

Pride goes before destruction, a haughty spirit before a fall (Proverbs 16:18)

Said differently, a fool and his money are soon parted.

Monday, December 08, 2014

As China’s Export Growth Falls, Import Growth Contracts, Stocks Fly!

China’s international trade data speaks loudly of the Chinese and global economic conditions.

The Zero Hedge writes: (bold original)
Chinese imports and exports dramatically missed expectations this evening but it is imports that was the real driver that pushed the trade surplus to $54.47 billion (higher than the $43.95 billion expected) record highs. Exports rose just 4.7% YoY (against expectations of an 8.0% rise and previous 11.6% rise) for the slowest growth since April. Imports utterly collapsed; plunging 6.7% YoY (against expectations of a 3.8% rise and prior 4.6% YoY rise). This is the biggest drop since March and 4th largest plunge since Aug 2009. Of course, in any real world this means 'the rest of the world' should be suffering from huge drops in exports... but we are sure, by the magic of fradulent invoicing that will not be the case. The PBOC may have got a glimpse and fixed CNY at its strongest since March and highest premium to the market since August.

image

Add to "the rest of the world' should be suffering from huge drops in exports", contracting imports postulates to a sharp slowdown in domestic economic activities. 

Yet the slowdown in exports have been blamed on supposed  crackdown on over-invoicing. Perhaps.

image

But this may also reflect on a substantial downdraft in the economic activities of China’s trading partners. (chart from statista.com)

I said last night
since 2008, stocks have NOWHERE been about G-R-O-W-T-H, but about LIQUIDITY and CREDIT from which CONFIDENCE or MOMENTUM has been a product of. Expand liquidity and or credit, then financial assets (stocks, real estate, bonds etc…) booms, regardless of the direction of the economy.
Well, bad news has actually been good news for Chinese stock market speculators
image

The Shanghai index has even broken the 3,000 levels! 

This according to the Bloomberg, has been the first time in 2011. Why? Because according to a quoted expert, “There are expectations for further rate cuts”

Well it’s not just China.  

Japan’s 3Q adjusted GDP reportedly fell to 1.9% from 1.6%. This means that the 3Q recession has been worst than originally estimated. 

No bad news for stocks, though. Japan’s Nikkei closed higher marginally higher by .08% today!

Wednesday, August 13, 2014

Japan’s Q2 GDP Plummets 6.8%!

Last June I wrote about the entangled state of the Japanese political economy due to the “Abenomics engineered economy.” 
It’s a wonder how the Japanese economy can function normally when the government destabilizes money and consequently the pricing system, and equally undermines the economic calculation or the business climate with massive interventions such as 60% increase in sales tax from 5-8% (yes the government plans to double this by the end of the year to 10%), and never ending fiscal stimulus which again will extrapolate to higher taxes.

The mainstream has all been desperately scrambling to look for “green shoots” via statistics. They fail to realize that by obstructing the business and household outlook via manifold and widespread price manipulations, this will only lead to not to real growth but to greater uncertainty which translates to high volatility and bigger risks for a Black Swan event.
All these multi-prong interventions appears to have caught up with the statistical economy as Japan’s GDP plummeted by 6.8% in 2Q 2014!  

From Bloomberg: (bold mine)
Japan’s economy contracted the most since the record earthquake three years ago as consumption and investment plunged after an April sales-tax increase aimed at curbing the world’s biggest debt burden.

Gross domestic product shrank an annualized 6.8 percent in the three months through June, the Cabinet Office said. That was less than the median estimate of 37 economists surveyed by Bloomberg News for a 7 percent drop. Unadjusted for price changes, GDP declined 0.4 percent…
Hopes for a Quick rebound?
While Prime Minister Shinzo Abe is counting on a quick rebound, the economy was struggling in June, with output falling the most since March 2011 as companies tried to pare elevated inventories. The government is ready to take flexible action if needed, Economy Minister Akira Amari said today, as Abe weighs whether Japan can bear another bump in the levy in 2015.
The damage has been widespread from consumption and trade which has spread to corporate profits.
Household consumption plummeted at an annualized pace of 19.2 percent from the previous quarter, while private investment sank 9.7 percent, highlighting the damage to demand by the 3 percentage point increase in the levy…

Imports tumbled an annualized 20.5 percent while exports fell 1.8 percent. That’s sapping the manufacturing sector and shows the yen’s 16 percent drop against the dollar over Abe’s term has yet to drive outbound shipments.

The windfall in corporate profits that the weaker yen delivered to many Japanese manufacturers last year also shows signs of fading.
Will PM Abe still push more tax hikes?
 
The Zero hedge has eye-catching and very telling charts on these.

image

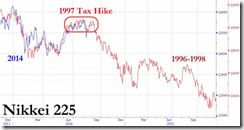
History rhymes. The collapse in GDP has even more than the 1997 counterpart. 

image

The collapse in spending has even been greater than 1997

image

Then Japan’s stocks crumbled. This we have yet to see today. The Nikkei is even marginally up as of this writing.

The reason for this has been most likely “bad news is good news”. The chronically addicted stimulus crowd have been waiting for the government “to take flexible action if needed”

Stocks have been about the economy?

Thursday, April 10, 2014

Behind the Furious Rally of the Philippine Peso

Last weekend I wrote
Yet we cannot discount any temporal relief rallies in both the peso and the treasury markets mainly due to interventions and secondarily from the interim RISK ON mode.

Remember Philippine treasury markets have not only been an illiquid market but have been tightly controlled by the government and their cohorts, the banking sector. I also expect the BSP to deploy some of their forex reserves rather than use the interest rate tool to keep the financial repression stimulus for the government ongoing.

image

The Philippine Peso mounted a fantastic (+1.33%) comeback the during the past 4 days.

This has been pillared by today’s whopping almost one percent (+.95%) run. The USD-peso chart above reveals of a seeming breakdown.

Mainstream media tell us that today’s export data and foreign flows has been the catalyst for the surge in the Peso

From the Bloomberg:
The Philippine peso strengthened to a one-month high as a report showed exports increased the most since 2010.

Overseas shipments in February rose 24.4 percent from a year earlier, the government reported today, compared with a revised 9.2 percent increase in January and the 16.6 percent gain forecast in a Bloomberg survey. Overseas investors have pumped $100 million into local stocks this month, taking inflows this year to $494 million, according to exchange data.

The peso advanced 0.5 percent to 44.533 per dollar as of 10:49 a.m. in Manila, according to Tullett Prebon Plc. The currency touched 44.475 earlier, the strongest level since March 11. One-month implied volatility, a measure of expected moves in the exchange rate used to price options, fell 15 basis points to 4.77 percent.

image

It has not been stated why a surge in exports should boost the peso. It was just rationalized or assumed in a post hoc manner that today’s export data from the Philippine government equates to the strength in the peso.

The above chart from the Philippine Statistics Authority reveals of the February jump in exports which has been led by electronic products which accounted for 40.6% of total exports.

image

Now if we look in the context of nominal US dollar trade where February’s huge jump accounts for $4.654.15 billion (preliminary), the 2014 data would look very less than impressive.

Why? For one, the level of February exports have not reached any new milestone highs. In fact, the February data has been lower than the level of exports during the third quarter of 2013 (red rectangle as superimposed by me on the chart of tradingeconomics).

What has really punctuated the supposed growth in exports has been the depressed export data of February 2013 (red arrow). This has made the February 2014 look outstanding. 

Thus, all the buzz on February exports has all been about the contrast principle—what you see depends on where you stand or what you compare with.

The Philippine government have not yet disclosed on the figures for February imports. So it is a curiosity to see why a supposed strong export growth (based on an statistical outlier) would influence the peso positively.

Yet if the growth of imports exceed exports then a trade deficit is in the order. Ceteris paribus, this isn’t peso bullish.

Nonetheless the recent ballooning of trade deficits have been offset by remittances and BPO proceeds—and as noted in the above report—the influx of money to chase extremely overpriced Philippine equities. The Phisix broke the 6,600 level to gain .64% today. Mania at its finest.

Yet since the peso’s meltdown during the third week of March, aside from last week’s raising of reserve requirements, the Philippine government seem to have been using the signaling channel to massage the Peso’s direction. Last week, the BSP reported “slower” statistical price inflation. Today aside from “strong” export data, the BSP reported positive FDI inflows. And as I previously noted above, the RISK ON environment has helped in the peso rebound.

But what has been largely ignored is that the BSP has been intervening to firm up the Peso. 

Two weeks back I wrote
Aside from the raising the reserve requirements ratio, given the wild intraday movements of the peso during the week, I deeply suspect that the BSP may have used anew forex reserves to defend the peso. 

image

My suspicion has been confirmed the Philippine forex reserve in March has indeed dropped, although by a margin.  

From the BSP:
This level was lower by US$0.7 billion than the end-February 2014 GIR of US$80.5 billion…The decline in reserves was due mainly to outflows arising from payments by the National Government (NG) of its maturing foreign exchange obligations, foreign exchange operations of the BSP, and revaluation adjustments on the BSP’s gold holdings and foreign-currency denominated reserves.
This simply proves my point that any improvement in the peso will have the BSP’s fingerprints on them.

image

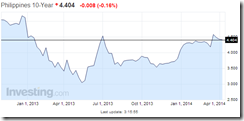
Ironically, to my surprise, yields of local 10 year treasuries have yet to get caught up with the mania—surge in the peso and in the Philippine stocks, they should be declining along with the USD-peso. 

The BSP and the Philippine government has been applying direct interventions as well as indirect measures (via the Talisman effect) to influence the "managed" domestic financial markets. Unfortunately, unless they address the 30++% growth in the domestic money supply, the effects from the above will be evanescent.

Oh by the way, the Chinese government today reported a substantial decline in her merchandise trade for March 2014, specifically for y-o-y exports fell 6.6% and imports 11.3% (Guardian)! This is significant. China has been the Philippines second largest export market after Japan with a 14.7 share of overall exports.

And going to Japan, the largest export market for the Philippines (with a 25.4% share in February), the Japanese government raised sales taxes from 5% to 8% this April. Unfortunately the Japanese consumers have hardly used the prospects of the coming higher taxes to stack up on daily necessities, but instead they drove a binge on big ticket items. 

From Reuters: (bold mine)
Japanese consumers spent more aggressively on higher-priced items like art works in the run-up to the tax than Takashimaya had expected, based on its experience in 1997, President and Chief Executive Shigeru Kimoto told a news conference. 

For April, the retailer forecasts a 14 percent drop in sales, followed by a nearly 6 percent decline in May and then an almost 4 percent drop in the three months to August
If the said forecasts becomes a reality, then Asian exports will suffer huge declines. So with Philippine exports. 

Good luck to the bubble worshipers.

Wednesday, March 12, 2014

EM Contagion: Based on Exports, Global Economic Growth appears to be Downshifting Fast

I have pointed to the recent collapse of exports by China and by Japan as potential harbinger of a substantial downshift in the growth rate of the global economy. 

Signs are that the world will be faced with a dramatic decline in the rate of growth if measured in exports. 

First of all here is the list of the top 15 exporting countries as provided by wikipedia.org
image

These countries, whose estimated US dollar priced exports at $13.885 trillion for 2013, constitute a substantial share in the (non-fixed) pie of global exports.

I have no figures for total world exports in 2013. So while this would be apples to oranges, if I use the above to compare with 2011 global export data then the top 15 countries would account for about 78% of global export share. A WTO report says that the share of the top 5 exporters represents 36% in 2012 almost equal to the trading volume of regional trading blocs. The point is to show the importance of the share of the above exports relative to the total.

Now aside from China and Japan here are the export trends of the other top 15 exporters
image

Eurozone exports have been in a sharp decline over the past (3 months) quarter.

But Eurozone performance have been unequal. Seen in the context of some of the Eurozone members within the top 15 ranking, German exports (ranked 3rd in the world) remain buoyant although markedly down from September highs. French exports (ranked 5th) have stagnated through most of 2013 compared to 2012 level. Spanish exports have substantially declined over the past 3 months while Italian exports marginally slowed over the same period.
image

Meanwhile US exports have been slightly down
image

South Korean exports have also been in a substantial downtrend. February exports plummeted by 5.7%. February data signifies a decline of 8.5% from October highs

Netherland exports fell sharply down by 5.3% in December (no latest updates yet)
image

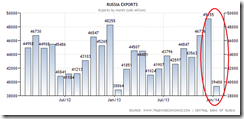
Russia’s exports, ranked 8th in the world, have collapsed last January! Russian exports cratered by 19.8% (m-o-m), and have essentially mirrored China. 

Meanwhile Hong Kong exports have been marginally down.

Ninth largest exporter, the United Kingdom broke the 5 month declining trend with a 2.1% (m-o-m) gain last January. Has this been a quirk or a recovery?

11 spot Canadian exports has also shown a marginal decline over the past 5 months. 

13th ranked Singapore exports posted a modest increase (2.86% m-o-m) in January but the gains have been far off from the highs of October. 

Saudi Arabian exports have been strong as of the third quarter of 2013
image

15th spot Mexican exports tanked by 15.73% (m-o-m) in January! 

To have a better view of emerging markets where we can see the extent of the recent damage, let us take a look at the export data of the other majors. 

Brazil’s exports have stagnated in February following a 23% crash in January.

India’s export trend has been in a moderate decline over the past 5 months.  

In Southeast Asia, Malaysia’s exports though posting a marginal decline in January, has remained robust relative to most of 2013.  

Meanwhile Thailand’s exports have fallen sizably over the past 5 months.  

And after a spike in December exports, Indonesia’s January data plunged by 14.63%. Indonesian exports collapsed in August 2013 but recovered until December.  

Following September and October highs Philippine exports have moderately declined over the past 3 months

In sum, for the top 15 only Saudi Arabia, Germany, UK and Singapore have shown recent export (marginal to modest) gains, whereas the export declines have been pronounced in emerging markets (e.g. Russia, Mexico, South Korea). And this has become even more evident with the inclusion of Brazil, Indonesia and Thailand.

The dramatic fall in Japan, the marked slowdown in the Eurozone and the recent downshift in US exports may be signs of the deepening emerging market contagion. 

Emerging market financial market disruptions seem to have now been manifesting real economic effects through the global economy.

Yet the current rate of decline in exports of emerging markets seems alarming. 

[As a side note, this is a treatment of aggregate exports without delving into their details]

And they seem to be reinforcing my fears and suspicions. As I wrote early February
If emerging markets has been attributed by some as having pulled out the global economy from the recession of 2008, now will likely be the opposite dynamic, the ongoing mayhem in emerging markets are likely to weigh on the global economy and equally expose on the illusions of strength brought upon by credit inflation stoked by inflationist policies.
All these comes as major stocks markets seem to be in various stages of a mania (either from record highs or for those bourses fighting off the bear markets with violent denial rallies).

It is interesting to see if there will be a collision course between global real economy and the steroid dependent stock markets hoping for a sustained economic recovery.

P.S. Thanks to the wonderful tradingeconomics.com for all the charts and the very helpful data they provide.