GDP is the most common out-of-context stat used by governments to convince the citizenry that all is well. It is yet another stat that is entirely manipulated by inflation. It is also manipulated by the way in which modern governments define "economic activity"—Brandon Smith
In this issue:
Philippine Q1 2024 5.7% GDP: Net Exports as Key Driver, The Road to Financialization and Escalating Consumer Weakness
I. As Predicted, Q1 2024 5.7% GDP Retreated and Reinforced the Secondary Trendline
II. Why the GDP is Not the Economy
III. Net Exports as Key Driver of Q1 2024 GDP
IV. The Money Illusion: Net Exports Increased Due to the Peso’s Devaluation
V. Despite Record Low Unemployment Rates, Entropy in Consumers’ Spending Capacity
VI. Weakening Consumers: Aggressive Consumer Borrowing and Drawdown in Savings
VII. Consumer Entropy: The Lagged Crowding Out Effects of Fiscal Deficit Spending
VIII. Export Boom? Manufacturing Bounced in Q1 2024, But Finance Industry Dominated the Field
IX. Q1 2024 Outperformance Led by Construction, Accommodation and Service Sectors
X. Trade and Real Estate Malinvestments: Supply Side Expands even as Demand Sputters
XI. Summary and Conclusion
Philippine Q1 2024 5.7% GDP: Net Exports as Key Driver, The Road to Financialization
The 5.7% GDP growth in Q1 2024 highlights net exports as the primary driver, alongside the trend toward financialization and a significant deceleration in consumer spending.
I. As Predicted, Q1 2024 5.7% GDP Retreated and Reinforced the Secondary Trendline
Reuters, May 9, 2024: The Philippine economy accelerated less than expected in the first quarter as weaker consumer spending restrained growth, reinforcing expectations that the central bank will leave interest rates unchanged next week, despite rising inflation. Gross domestic product grew 5.7% in the first three months from the same period last year, the statistics agency said on Thursday, up from the previous quarter's 5.5% but below the 5.9% forecast in a Reuters poll.
Let us begin this analysis by examining the GDP trend.

Figure 1
After the Q4 seasonal breach, Q1’24 GDP dropped back to the exponential trendline support level, reinforcing it. (Figure 1, upper chart)
Originating from the pandemic recession in 2020, the secondary trend indicates that GDP growth will be significantly slower than in the pre-pandemic era.
Q1 GDP’s confirmation of this trendline validates our analysis from last November:
Regardless of consensus opinion, the coming GDPs will likely bounce within the range of the second trendline marked by the ceiling (exponential trend) and the floor (trend support). The percentage change will be a function of base effects. (Prudent Investor 2023) [bold original]
It also implies that any pompous projections that disregard this trendline are likely to deviate.
Additionally, given the fragility of the nascent trendline and considering the evolving internal conditions, the likelihood leans towards a downside break rather than an upside.
Of course, since expenditures underpin GDP, authorities could induce another breach through monetary easing—essentially flooding the economy with currency—similar to the 2020 episode. However, this would result in a surge of inflation, which should offset the initial effects.
Or, incidences of an upside break could be "transitory" or unsustainable.
As a side note, the Philippine Statistics Authority (PSA) revised the national accounts data from Q1 2022.
II. Why the GDP is Not the Economy
The GDP is a statistical construct of the economy, calculated based on technical assumptions embedded in its model. This model presupposes a perspective that the economy is centrally or top-down driven, making GDP a political statistic susceptible to biases and subject to the stratagem of incumbent political authorities, without any (independent) auditing process.
For example, the headline GDP can be inflated by understating inflation. While inflation increases the top-line or nominal numbers, a suppressed inflation rate widens the gap—the real or headline GDP. (Figure 1, lower graph)
One of the primary purposes of "painting the GDP tape " is to provide the government with easy access to the public’s income and savings by justifying taxes and borrowings, while another is to rationalize the exercise of political control over its subjects.
Furthermore, news headlines may portray a different economic landscape than that presented by the statistical economy
Here are some of the latest:
-Businessworld, March factory output falls, steepest in almost 2 years, May 9, 2024
-Inquirer.net, Over 5,000 PH garment factory workers lose jobs May 7, 2024
-ABS-CBN News, SM Investments Q1 net income up 6 percent at P18.4 billion but retail slips, May 8, 2024
-Manila Standard, Trade deficit narrowed to $3.2b as exports, imports fell in March, May 8,2024
-Inquirer.net, SWS: Families who suffer from hunger rises to over 14%; highest rate in NCR, May 01,2024
-GMA News, NCR office space rental prices seen to drop as vacancy levels increase — JLL, April 25, 2024
-GMA News, SWS poll: 46% of Filipino families consider themselves poor, April 25, 2024
Even if we somehow reckon that the GDP numbers reflect reality, who benefits from it? Cui bono? These headlines suggest it was not the average Filipinos.
Yet, why is there a difference in the presented number and the headlines?
Moreover, if the weighted average of the inflation rates of billionaires and the street poor can be considered as apples-to-oranges, wouldn’t calculating a similar weighted average growth for software design fees and palay harvesting result in a similarly flawed representation of the economy?
III. Net Exports as Key Driver of Q1 2024 GDP
Let us examine the expenditure side of the GDP.

Figure 2
Consumers were visibly scrimping while the government was also in a penny-pinching mode. Their real GDPs were up by only 4.6% and 1.7% in Q1 2024, respectively. (Figure 2, topmost image)
However, government spending excludes government construction and other capex expenditures.
Meanwhile, stagnation also affected gross capital formation, and imports, which grew by 1.3% and 2.3%, correspondingly. (Figure 2, second to the highest diagram)
On the other hand, exports (goods and services) which surged by 7.5%, delivered the goodies—via the net export route (exports minus imports).
In essence, exports signified the cornerstone of Q1 2024’s growth.
IV. The Money Illusion: Net Exports Increased Due to the Peso’s Devaluation
But other data on merchandise trade from the Philippine Statistics Authority presents a different perspective.
Exports in USD shrank by 7.6%. But due to peso devaluation, they rose by 6.9% when calculated using the average peso for the period. (Figure 2, second to the lowest left graph)
Semiconductor exports, which accounted for 46% share last March, contracted by .18% after a sizzling 32% growth last February. Though semicon exports (in million USD) bounced in March, it has been on a downtrend since its zenith in October 2022. (Figure 2, second to the lowest right chart)
The export slump partially explains the labor retrenchment in garment factories and the two-year drop in factory output.
The cited export data pertains solely to goods exports, which, in the context of the GDP, accounted for 46% of the total. Services represented the majority.
On the other hand, since the pinnacle in 2022, stagnation has also affected imports of capital and consumer goods (in millions USD).
Although consumer imports increased by 6.6% last March, capital goods imports plunged by 14.8%—marking the third straight monthly drop and its largest decline since August 2023.
Importantly, since reaching its peak in 2022, global trade (in millions USD) has significantly slowed. (Figure 2, lowest window)
Could this be symptomatic of the intensifying geopolitical tensions and monetary disorders?
In summary, a substantial segment in the increase in the GDP can be attributed to the effects of peso devaluation! The money illusion!
That is to say, inflation presented as economic growth!
Incredible.
V. Despite Record Low Unemployment Rates, Entropy in Consumers’ Spending Capacity
But why the sustained slowdown of consumer spending?

Figure 3
Despite the labor force reaching the second-highest employment (or second-lowest unemployment) rates in Q1 2024, consumer per capita income tumbled to its lowest level since 2021! (Figure 3, topmost chart)
Why would more jobs lead to reduced consumption? Could it be that the public has increased their savings?
Interestingly, retail, government (public administration and defense), and financial sectors have spearheaded year-to-date (YTD) employment gains. (Figure 3, middle image)
Has the surge in defense jobs signified a partial transition to a war economy?
Despite a 6% drop in March, part-time jobs accounted for 30% of the employed population. (Figure 3, lowest diagram)
Part-time jobs comprised almost all of the job gains last February (Prudent Investor, 2024)
Could the employment numbers have been exaggerated to boost the GDP and the approval ratings of the administration, or were the increases in jobs primarily low-quality positions?
VI. Weakening Consumers: Aggressive Consumer Borrowing and Drawdown in Savings
Furthermore, bank lending, primarily through consumers, played a crucial role in driving household consumption and industry GDP.

Figure 4
Universal commercial banks saw a significant 9.45% increase in their lending portfolio in March/Q1 2024, marking the third consecutive quarterly growth and reaching its highest level since Q1 2023. (Figure 4, topmost graph)
Household borrowing surged at a rapid pace of 25.4%, marking the seventh consecutive quarter of over 20% growth and the highest rate since Q2 2020!
In the meantime, production loans also saw growth, rising by 7.7% for the third consecutive quarter, reaching the highest level since Q1 2023.
In other words, without the growth in bank credit, consumer GDP would have cratered, potentially causing the GDP to contract!
Alternatively, even with the magnified use of consumer credit, the downward trend in household spending growth persists.
What would the household GDP look like without it?
Nevertheless, this represents a symptom that credit has supported household expenditures rather than productivity growth.
In the face of high inflation, consumers resorted to borrowing from banks and financial institutions to sustain their lifestyles.
But that’s not all; they have also drawn from their savings.
Consequently, for the banked population, this resulted in a sharp slowdown in peso savings growth from 3.13% in February to 2.15% in March. (Figure 4, middle diagram)
As a result, total bank deposit growth inched up from 7.86% to 8% over the same period, primarily due to the jump in FX deposits from 22% in February to 24.7% in March in response to the peso’s devaluation.
Rising domestic interest rates have barely induced savings; it is the fall in the peso that has driven increases in FX deposits.
So, does this represent confidence in the Philippine economy?
The thing is, consumers have been aggressively borrowing from banks and drawing from savings to cover their lifestyle deficit caused by persistent inflation and malinvestments.
It is unsurprising that this has limited their purchasing capacity regardless of the actual conditions of the labor market, which authorities have declared to be near full employment.
Surveys indicating the rising prevalence of hunger and increased incidences of self-poverty can be explained by this phenomenon.
VII. Consumer Entropy: The Lagged Crowding Out Effects of Fiscal Deficit Spending
Moreover, all this occurs even as the government has slowed its deficit spending.
The deficit to GDP ratio dropped to 4.5%—the lowest since Q2 2020. (Figure 4, lowest image)
Yes, government spending was subdued in Q1, but that represented direct expenditures. Nonetheless, the government's share of GDP continues to rise, which simultaneously comes at the expense of consumers.
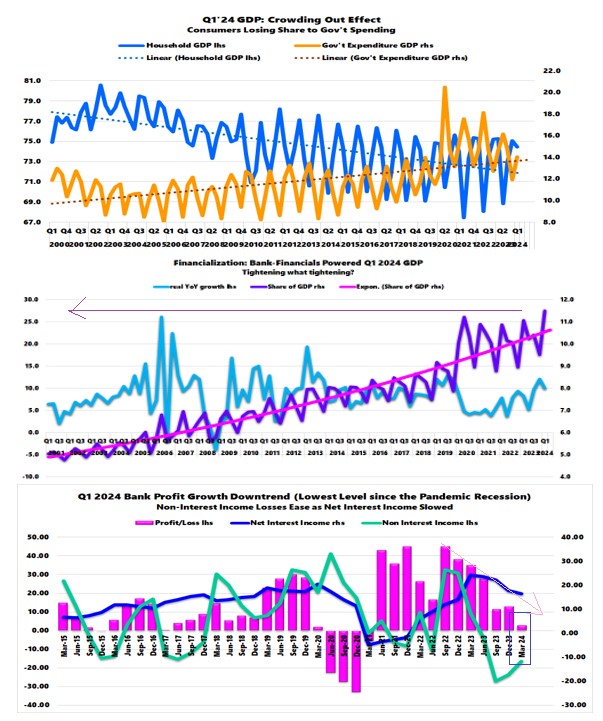
Figure 5
The share of Household GDP fell from 75.1% in Q4 2023 (75.3% in Q1 2023) to 74.5% in Q1 2024, while the share of government surged from 11.9% to 14.1% over the same period. (Figure 5, topmost graph)
Q1 2024 GDP reinforced its respective long-term trends.
The redistribution effects of deficit spending and malinvestments become increasingly apparent over time.
VIII. Export Boom? Manufacturing Bounced in Q1 2024, But Finance Industry Dominated the Field
Like balance sheets, the obverse side of the GDP’s expenditure side is the industry.
If exports were booming as so-indicated by the Expenditure GDP, then manufacturing must be outperforming.
At 20%, manufacturing has the largest share of the industry GDP, nonetheless, it posted a 4.5% GDP—below the headline GDP, but signified the highest since Q1 2022.
Labor retrenchment in parts of the sector and the March plunge in factory data contradicts the PSA’s national accounts data.
What sectors boomed in Q1 2024?
Financials emerged as one of the fastest-growing sectors, registering a real GDP growth rate of 10%. Notably, the sector's share of the total GDP reached an all-time high of 11.5%, making it the third-largest sector after manufacturing (20%) and retail (16.4%). (Figure 5, middle window)
Banks significantly outperformed their non-bank financial counterparts, expanding by 12.7% in Q1 2024 and increasing their share of the industry's pie from 49.3% in Q4 to a historic 61.1% in Q1 2024.
The share of banks relative to Total Financial Resources hit the second-highest level of 83.42% last February, indicating the increasing GDP's financialization orfinancialization of the GDP or characterized by intensifying gearing or leveraging.
However, despite banks' substantial contribution to the GDP, Q1 2024 profit growth was only 2.95%, marking its lowest level since the pandemic recession in 2020! (Figure 5, lowest graph)
Crucially, profit growth has been on a downward trend since peaking in Q3 2022, largely impacted by sharp declines in non-interest income influenced by rising rates, as well as the decrease in interest income.
Rising GDP, falling (inflated) profits while increasing systemic credit risks via massive expansion in leverage.
Incredible.

Figure 6
As a side note, the BSP declared that the country should benefit from the deluge of equity FDI flows for the month of February, which "came from the Netherlands with investments directed mostly to the financial and insurance industry." Equity and investment funds growth rocketed by 480% to USD 830 million, which pushed higher total FDI flows by 29.3% to USD 1.364 billon. (Figure 6, topmost chart)
If true, this translates to more players entering a saturated industry. We shall soon see how this impacts the economy.
IX. Q1 2024 Outperformance Led by Construction, Accommodation and Service Sectors
The construction industry is another sector that outperformed in Q1 2024. Despite its real GDP growing by 7%, its share of the national accounts' pie fell from 7.2% to 6%.
Government construction registered the highest GDP growth at 12.4%, marking the third consecutive quarterly decline in growth. Meanwhile, financial and non-financial construction posted a real GDP growth of 6.7%, the highest in the last three quarters, but significantly lower rates than those observed from 2022 through Q2 2023. Government and private sector construction accounted for 26% and 43.4% of the industry, respectively. (Figure 6, middle image)
However, the industry's GDP doesn’t reveal the distribution of activities or what percentage are part of Public-Private Partnerships (PPPs).
Finally, even with a 2.7% share, accommodation and services posted the fastest GDP in Q1 2024 with 13.9%. The sector has outperformed its contemporaries in the last four quarters. (Figure 6, lowest window)
Nevertheless, based on share of the GDP, the sector has fully recovered from the pandemic recession troughs.

Figure 7
The surge in "revenge travel " and staycations has propelled accommodation GDP growth to a brisk 18.4%, compared to food services at 11.9%. Nonetheless, food services retain the largest share of the industry at 68.3%.
Although the industry zoomed, during the reopening of the economy, the pace of growth has since diminished.
In the face of harried and leveraged domestic consumers, the Department of Tourism data suggests a likely peak in inbound visitors. April arrivals grew by 2.92% year-over-year but shrunk by 9.6% month-over-month (MoM) for the second straight month. (Figure 7, upper graph)
While investors pursue recent growth by expanding capacity, industry prospects could be poised for a reversal from the current boom.
X. Trade and Real Estate Malinvestments: Supply Side Expands even as Demand Sputters
How about the trade and the real estate sectors?
While consumers struggle, the trade industry GDP improved from 5.2% in Q4 2023 to 6.4% in Q1 2024, its largest since Q1 2023. (Figure 7, lowest chart)
Retail GDP substantially improved from 5.7% in Q4 2023 to 7.3% in Q1 2024 while wholesale GDP steadied at 2.3% over the same period.
Retail trade accounted for 81.5% of the sector’s GDP, up from 79% in Q4 2023.
This divergence suggests that trade investors, like accommodation and food services, have splurged on building capacity, against the backdrop of consumers' diminishing spending capability.
The sustained divergence would likely lead to financial pressures on many retail outlets including national retail chains.
Financial pressures on the retail segment of SM, an economic titan, showcases this challenge. (SM has yet to report its Q1 17Q)

Figure 8
Lastly, the real estate sector, one of the most popular or say the crowd’s favorite, saw its GDP slow considerably from 5.5% in Q4 2023 to 4.1% in Q1 2024. (Figure 8, upper chart)
However, its share of the GDP bounced from an all-time low of 5.1% in Q4 2023 to 5.6% in Q1 2024.
Despite this, the sector’s share of bank lending continues to mount, it reached 20.7% in Q4 2023 and slipping to 20.6% in Q1 2024.
That is to say, while the public have jumped on the bandwagon to chase gains from the industry, often funded by increasing leverage, its contribution to the national economic value continues to decline—a manifestation of malinvestments.
Even the mainstream has become aware of the escalating accounts of vacancies, which they see as increasing further due to supply outgrowing demand.
While all eyes are on the sector bearing a pipe dream of its revival, oddly, the professional and business services sector has slowly and steadily been outpacing the former. It posted a GDP of 7.5%—its highest rate since Q1 2023.
Interestingly, the sector’s economic contribution—measured by its share of the total—has been steadily outpacing the real estate sector since Q2 2022. It had a 5.8% share against the 5.6% of the latter in Q1 2024. (Figure 8, lower window)
The professional and business services sector encompass various types of services, including legal, photographic, engineering, architectural, veterinary, and all other scientific and technical fields.
While many of its services appear to be closely linked with core industry groups, we can infer that its growth contribution arises from a relatively low starting point.
Consequently, economic risks may be considerably lower compared to other sectors.
So, despite the widespread economic maladjustments, viable opportunities still exist.
XI. Summary and Conclusion
Q1 2024 GDP retreated and reinforced its second but slower trendline, magnifying the risk of a breakdown.
As a result of the peso’s devaluation, net exports contributed most to the Q1 2024 GDP expansion.
The risks of violating the downside of the GDP trendline appear supported by the substantial slowing of consumer expenditures, driven by massive bank leveraging and a drain of savings.
Furthermore, the "build and they will come" mantra remains a model embraced by popular industries like trade, accommodation and services, and retail, backed by financing from banks, thereby raising systemic risks.
Once again, when the economy slows substantially or recession risks mount, monetary authorities will likely resort to the 2020 pandemic playbook: substantially easing interest rates, infusing record amounts of liquidity, and deepening the imposition of relief measures. Alongside this, political authorities are likely to drive deficits to reach record levels.
___
References
Brandon Smith, Economic Earthquake Ahead? The Cracks Are Spreading Fast, March 7, 2024 Birchgold.com
Prudent Investor Newsletter, The “Surprise‟ Philippine 5.9% Q3 GDP Powered by Deficit-Spending and Bumped by a Statistical Facade November 12, 2023
Prudent Investor Newsletter, The Jump in February’s Philippine Employment Rate was all about Part-Time Jobs! BSP’s Consumer Sentiment: Stagflation Ahoy! April 14, 2024