Devaluing is a de facto default and the manifestation of the insolvency of a nation—Daniel Lacalle
In this Issue
The USD-PHP Breaks 59: BSP’s Soft Peg Unravels, Exposing Economic Fragility
Part I: The USD-Philippine
peso Breach at Php59
IA.
The Soft Peg’s Strain Finally Shows
IB.
"Market Forces" or Managed Retreat?
IC.
Gold, GIR, and the Mirage of Strength
ID.
Historical Context: Peso Spikes and Economic Stress
Part II: The
Savings–Investment Gap (SIG) Illusion
IIA.
Savings–Investment Gap—a Flawed Metric and Free Lunch Spending
IIB.
Misclassified Investment, ICOR and the Productivity mirage
Part
III: Soft Peg Unravels: Systemic Fragility Surfaces, Confidence Breakdown
IIIA.
The Keynesian Hangover: How "Spending Drives Growth" Became National
Pathology
IIIB.
Credit-Fueled Consumption and Fiscal Excess: Twin Deficits
IIIC.
CMEPA and the Deepening of Financial Repression: How the State
Institutionalized Capital Flight
IIID.
Corruption as Symptom, Not Cause: The Flood Control Scandal and Malinvestment
Crisis
IIIE.
The Soft Peg's Hidden Costs: FX Regime as Subsidy Machine and Flight Accelerant
IIIF.
Gold Sales Redux: The 2020–2021 Playbook Returns
IIIG.
GIR Theater: Borrowed Reserves and Accounting Opacity, Slowing NFA and Widening
BOP Gap
IIIH.
Soft Peg Lessons: Where From Here? Historical Patterns and the Road to 62—or
67?
IV. Conclusion: Why This Time May Be Worse, the BSP is Whistling Past the Graveyard
The USD-PHP Breaks 59: BSP’s Soft Peg Unravels, Exposing Economic Fragility
How the BSP’s widening savings–investment gap, soft peg, flood control response left the peso exposed—and what it reveals about the Philippine economy.
Part I: The USD-Philippine peso Breach at Php59
IA. The Soft Peg’s Strain Finally Shows
This is what we posted at X.com
- 👉 Record savings–investment gap (BSP easing, deficit spending, CMEPA)
- 👉 BSP soft peg (gold sales)
- 👉 Capital controls fueling flight
- 👉 Weak economy + high debt
The soft peg’s strain finally shows.
After three years of tacit defense, the BSP’s 59.00 line cracked on October 28. Yet it closed the week—and the month—at 58.85, just below what we’ve long called the BSP’s ‘Maginot line.’
IB. "Market Forces" or Managed Retreat?
The BSP and media attributed the breach to “market forces.” But if the peso’s rate is truly market-determined, why issue a press release at all? To reassure the public? Why the need for reassurance? And if the breakout were merely “temporary,” why frame it at all—unless the goal is to condition perception before the markets interpret the breach as systemic or draw their own conclusions?

Figure 1
Another dead giveaway lies in the BSP’s phrasing: it “allows the exchange rate to be determined by market forces.” (Figure 1, upper image)
It presupposes BSP supremacy over the market, implying that exchange rate movements occur only at the central bank’s discretion. FX determination, in this framing, is not a spontaneous process but a managed performance. Market forces operate only within the parameters permitted by the BSP. “Allowing” or “disallowing” thus reflects not market discipline, but bureaucratic control masquerading as market freedom.
Yet, the irony is striking: they cite “resilient remittance inflows” as a stabilizer—even as the peso weakens. If OFW remittances, BPO earnings, and tourism inflows are as strong as claimed, what explains the breakdown?
Beneath the surface, the pressures are unmistakable: thinning FX buffers, rising debt service, and the mounting cost of defending a soft peg that was never officially admitted.
IC. Gold, GIR, and the Mirage of Strength
Then there’s the gold angle.
In 2024, the BSP was the world’s largest central bank seller of gold—offloading reserves to raise usable dollars. (Figure 1, lower chart)

Figure 2
Now, higher gold prices inflate its GIRs on paper—an accounting comfort masking liquidity strain. It’s the same irony we saw in 2021–22, when the BSP sold gold amid a pandemic recession and the peso still plunged. (Figure 2, upper graph)
Adding to the drama, the government announced a price freeze on basic goods just a day before the peso broke Php 59. Coincidence—or coordination to suppress the impact?
And there was no “strong dollar” to blame. The breakout came as ASEAN peers—the Thai baht, Indonesian rupiah, Singapore dollar, and Malaysian ringgit—strengthened. This was a PHP-specific fracture, not a USD-driven move. (Figure 2, lower table)
ID.
Historical Context: Peso Spikes and Economic Stress

Figure 3
Historically, sharp spikes in USDPHP have coincided with
economic strain:
- 1983 debt restructuring
- 1997 Asian Financial Crisis
- 2000 dotcom bubble bust
- 2008–2010 Global Financial Crisis
- 2020 pandemic recession (Figure 3, upper window)
The BSP even admitted “potential moderation in economic growth due in part to the infra spending controversy” for this historic event. That makes reassurance an even more potent motive.
Remember: USDPHP made seven attempts to breach 59.00—four in October 2022 (3, 10, 13, 17), three from November 21 and 26 to December 19, 2024. That ceiling revealed the BSP’s implicit soft peg. The communique doesn’t explain why the eighth breach succeeded—except to say it was “market determined.” But that’s just another way of saying the market has abandoned the illusion of BSP control. (Figure 3, lower diagram)
As I’ve discussed in earlier Substack notes, this moment was years in the making:
- The widening savings–investment gap
- CMEPA’s distortions
- Asset bubbles, the creeping financial repression and fiscal extraction that eroded domestic liquidity
The peso’s breach of 59 isn’t just a technical move. It’s the culmination of structural stress that monetary theater can no longer hide.
Part II: The Savings–Investment Gap (SIG) Illusion
IIA. Savings–Investment Gap—a Flawed Metric and Free Lunch Spending
Spending drives the economy. That ideology underpins Philippine economic policy—from the BSP’s inflation targeting and deficit spending to its regulatory, tax, and FX regimes—and it has culminated in a record savings–investment (SIG) gap.
This is the Keynesian hangover institutionalized in Philippine policy—confusing short-term demand management with sustainable capital formation
But this is not merely technocratic doctrine; the obsession with spending anchors the free-lunch politics of ochlocratic social democracy.
Yet even the SIG is a flawed metric.
As previously discussed, “savings” in national accounts is a residual GDP-derived figure riddled with distortions, not an empirical aggregation of household or corporate saving. It even counts government savings—retained surpluses and depreciation allowances—when, in truth, fiscal deficits represent outright dissaving. (see reference)
Worse, the inclusion of non-cash items such as depreciation and retained earnings inflates measured savings, masking the erosion of actual household liquidity.
IIB. Misclassified Investment, ICOR and the Productivity mirage
Even the “investment” side is overstated. Much of it is public consumption misclassified as capital formation. Because politics—not markets—dictate pricing and returns, the viability of monopolistic political projects cannot be credibly established.
Consider infrastructure. Despite record outlays, the
Incremental Capital-Output Ratio (ICOR) has worsened—proof that spending does
not equal productivity.

Figure 4
According to BSP estimates, the Philippines’ ICOR has fallen from around 8.3 in the 1989-92 period to approximately 4.1 in 2017-19, contracted by 12.7% and recovered to around 3.0 by 2022 (see reference) (Figure 4, topmost visual)
While the ICOR trend suggests some efficiency gains since the 1990s, it remains a blunt and often misleading proxy—distorted by GDP rebasing, project misclassification, and delayed returns. What it does reveal, however, is the widening gap between spending and sustainable productivity
Listed PPP firms, meanwhile, sustain appearances through leverage, regulatory capture and forbearance, and mark-to-model accounting. The result is concealed fragility, reinforced by the hidden costs of various acts of malfeasance, conveniently euphemized as by the public as “corruption.”
In the end, the SIG tells a simple truth: domestic savings are too scarce to fund both public and private investment. The gap is bridged by FX borrowing.
But this is not a sign of strength—it’s a symptom of deepening structural dependence, masked by monetary theater and fiscal illusion, thus amplifying peso vulnerability. Every fiscal impulse now imports external leverage, entrenching the illusion of growth at the expense of stability.
Part III: Soft Peg Unravels: Systemic Fragility Surfaces, Confidence Breakdown
IIIA. The Keynesian Hangover: How "Spending Drives Growth" Became National Pathology
Spending-as-growth isn’t just policy—it’s pathology.
Banks have realigned their balance sheets accordingly. Consumer loans by universal and commercial banks rose from 8.2% of total lending in December 2018 to 13.5% in August 2025—a 64% surge—while the share of industry loans declined from 91.7% to 86.5% over the same period. (Figure 4, middle pane)
Fueled by interest rate subsidies and real income erosion, households are leveraging aggressively to sustain consumption. Yet as GDP growth slows, the marginal productivity of credit collapses—meaning every new peso of debt generates less output and more fragility for both banks and borrowers.
Production credit’s stagnation also forces greater import dependence to meet domestic demand.
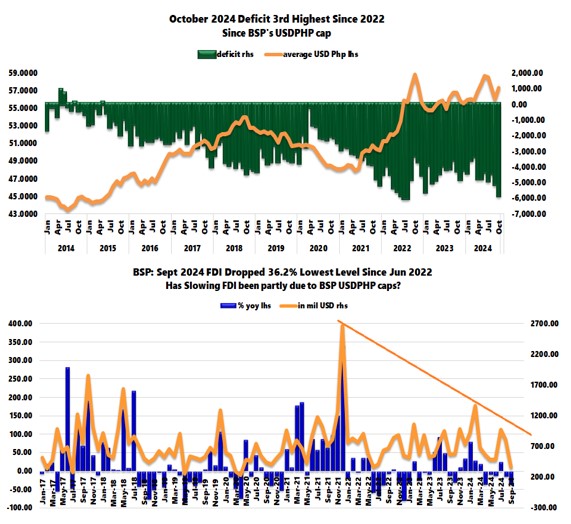
IIIB. Credit-Fueled Consumption and Fiscal Excess: Twin Deficits
Meanwhile, deficit spending—now nearing 2021 pandemic levels—artificially props up consumption at the expense of productivity gains. (See reference for last week’s Substack.)
Together, credit-fueled consumption and fiscal excess have produced record "twin deficits." (Figure 4, lowest chart)
The fiscal deficit widened from Php 319.5 billion in Q2 to Php 351.8 billion in Q3, while the trade deficit expanded from USD 12.0 billion to USD 12.76 billion—levels last seen in 2020.
Historically, fiscal deficits lead trade gaps—it
raises import demand. If the budget shortfall hits fresh records by year-end,
the external imbalance will likely push the trade deficit back to its 2022
peak.

Figure 5
These deficits are not funded by real savings but by credit—domestic and external. The apparent slowdown in approved public foreign borrowings in Q3 likely masks rescheduling (with Q4 FX borrowings set to spike?), delayed recognition, shift to BSP-led financing (to reduce scrutiny) or accounting prestidigitation (Figure 5, topmost diagram)
Public external debt accounted for roughly 60% of the record USD 148.87 billion in Q2. Even if Q3 slows, the trajectory remains upward. (Figure 5, middle graph)
In short, widening twin deficits mean more—not less—debt.
Slowing consumer sales growth, coupled with rising real estate vacancies, signals that private consumption is already being crowded out—a deepening symptom of structural strain in the economy.
Yet the newly enacted CMEPA (Capital Market Efficiency Promotion Act, R.A. 12214) deepens the financial repression: it taxes savings, institutionalizes these by redirecting or diverting household savings into state-controlled channels or equity speculation, and discriminates against private-sector financing. By weakening the deposit base, it also amplifies systemic fragility. The doubling of deposit insurance last March, following RRR cuts, appears preemptive—an implicit admission of the risk CMEPA introduces.
Authorities embraced a false choice. Savers are not confined to pesos—they can shift to dollars or move capital abroad entirely. Capital flight is not theoretical; for the monied class, it can be a reflexive response.
IIID. Corruption as Symptom, Not Cause: The Flood Control Scandal and Malinvestment Crisis
The recent “flood control” corruption scandal has merely exposed the deeper rot.
Consensus recently blames the peso’s fall and stock market weakness on “exposed corruption.” But this is post hoc reasoning: both the peso and PSEi 30 peaked in May 2025—months before the scandal broke. (Figure 5, lowest image)
Corruption, as argued last week, is not an aberration—it’s embedded or a natural expression of free-lunch social democracy
It begins at the ballot box and metastasizes through centralization, cheap money, financial repression, the gaming of the system and rent-seeking. It explains the entrenchment of political dynasties and the extraction economy they operate on.
What media and the pundits call “corruption” is merely the visible tip. The deeper pathology is malinvestment—surfacing across:
- Bank liquidity strains
- Wile E. Coyote NPLs
- Record real estate vacancies
- Slowing consumer spending despite record debt
- Cracks in employment data
- Persistently elevated self-rated poverty ratings (50% + 12% borderline as of September).
- Stubborn price pressures and more…
The BSP’s populist response to visible corruption?
Capital controls, withdrawal caps, probes, and virtue signaling. These have worsened the erosion of confidence, potentially accelerating the flight to foreign currency—and escalating malinvestments in the process. (see reference)
What emerges is not just structural decay, but a slow-motion confidence collapse.
IIIE. The Soft Peg's Hidden Costs: FX Regime as Subsidy Machine and Flight Accelerant
And there is more. The BSP also operates a de facto FX soft-peg regime.
By keeping a lid on its tacit thrust to devalue, its
implicit goal is not merely to project macro stability, but to subsidize the
USD and manage the CPI within its target band. Unfortunately, this policy overvalues
the peso, encouraging USD-denominated borrowing and external savings while
providing the behavioral incentive for capital flight.

Figure 6
Including public borrowing, the weak peso has prompted intensified growth in the banking system’s FX deposits. In August 2025, FX deposits rose 11.96%—the second straight month above 10%—reaching 15.07% of total bank liabilities, the highest since November 2017. (Figure 6, topmost window)
The BSP’s FX regime also includes its reserves management—Gross International Reserves (GIR).
IIIF. Gold Sales Redux: The 2020–2021 Playbook Returns
As noted above, similar to 2020–2021, the BSP embarked on massive gold sales to defend the USDPHP soft peg. Yet the peso still soared 22.97% from 47.90 in May 2021 to 58.9 in September 2022. That pandemic-era devaluation coincided with a CPI spike—peaking at 8.7% in January 2023. The 2024 gold sales echo this pattern, offering a blueprint for where USDPHP could be heading.
The BSP insists that benchmarks like the GIR assure the public of sufficient reserves. Yet it has never disclosed the composition in detail. Gold—which the BSP remains averse to—accounts for only ~15% of the GIR (September). A former BSP governor even advocates selling gold "to profit” from it." (2020 gold sales and devaluation occurred in his tenure)
But since the BSP doesn’t operate for profit-and-loss, but for political objectives such as "price stability," this logic misrepresents intent.
IIIG. GIR Theater: Borrowed Reserves and Accounting Opacity, Slowing NFA and Widening BOP Gap
A significant portion of GIR—around 5%—consists of repos, derivatives, and other short-term instruments classified as Other Reserve Assets (ORA), introduced during the 2018 peso appreciation. Not only that: national government borrowings deposited with the BSP are also counted as GIR. Hence, “borrowed reserves” make up a substantial share. (Figure 6, middle graph)
If reserves are truly as strong as officially claimed, why the peso breakout—and the need for a press release?
All this is reflected in the stagnating growth of BSP net
foreign assets (NFA) since 2025, reinforcing a downtrend that began in
2013. While nominally at Php 6.355 trillion, NFA is down 2.1% from the record
Php 6.398 trillion in November 2024. (Figure 6, lowest diagram)

Figure 7
This fragility is also evident in the balance of payments (BOP) gap. Though narrowing in recent months, it reached USD 5.315 billion year-to-date—its highest since the post-pandemic recession of 2022. That’s 67% of the November 2022 peak. (Figure 7, topmost graph)
The apparent improvement merely reflects deferred pressure—delayed borrowings and import compression.
Despite BSP claims, net outflows reflect more than trade gaps. They signal external debt servicing amid rising leverage, capital flight, and systemic strain.
IIIH. Soft Peg Lessons: Where From Here? Historical Patterns and the Road to 62—or 67?
Last March, we wrote:
The USDPHP exchange rate operates under a ‘soft peg’ regime, meaning the BSP will likely determine the next upper band or ceiling. In the previous adjustment, the ceiling rose from 56.48 in 2004 to 59 in 2022, representing a 4.5% increase. If history rhymes, the next likely cap could be in the 61–62 range. (see reference)
At the time, our lens was historical—measuring breakout levels from 2004 to 2022 and projecting forward to 2025.
But as noted above, USDPHP spikes rarely occur in a vacuum. They tend to coincide with economic stress. Using BSP’s end-of-quarter data, we find: (Figure 7, middle table)
- 1983 debt restructuring: +121% over 12 quarters (Q1 1982–Q1 1985)
- 1997 Asian Financial Crisis: +66.15% over 6 quarters (Q1 1997–Q3 1998)
- 1999–2004 dotcom bust: +30.6% over 20 quarters (Q2 1999–Q1 2004)
- 2007–2009 Global Financial Crisis: +16.95% over 5 quarters (Q4 2007–Q1 2009)
- 2020–2022 pandemic recession: +22.64% over 7 quarters (Q4 2020–Q3 2022)
While the USDPHP also rose from 2013–2018, this episode was largely driven by the Fed’s Taper Tantrum, China’s 2015 devaluation, and Trump-era fiscal stimulus—with no comparable economic event.
IV. Conclusion: Why This Time May Be Worse, the BSP is Whistling Past the Graveyard
The current moment is different.
Using the post-2022 low—Q2 2025 at 56.581—as a base, a 10% devaluation implies a target of 62.24. But with the late-cycle unraveling, a weakening domestic economy, and rising debt burdens, the odds tilt towards a deepening of stagflation—or worse. If the peso mirrors its pandemic-era response, a 20% devaluation to 67.90 is not far-fetched.
Even the BSP now concedes "potential moderation in economic growth."
Yet it continues to cite “resilient inflows” like tourism. The Department of Tourism data tells another story: as of September 2025, foreign arrivals were down 3.5% year-on-year—hardly a sign of strength. (Figure 7, lowest chart)
Otto von Bismarck’s maxim applies:
Never believe anything in politics until it has been officially denied.
Hounded by diminishing returns and Goodhart’s Law—where every target becomes a distortion—the BSP clings to benchmarks that no longer signal strength. From the USDPHP to GIR composition, Net Foreign Assets, and FX deposit ratios, the metrics have become theater. The more they’re defended, the less they reflect reality.
In the face of unraveling malinvestments, deepening institutional opacity, and accelerating behavioral flight, the BSP is whistling past the graveyard.
Caveat emptor. The illusion is priced in.
____
References
Bangko Sentral ng Pilipinas, Discussion Paper Series No. 2024-10: Estimating the Incremental Capital Output Ratio (ICOR) for the Philippines, Towards Greater Efficiency: Estimating the Philippines’ Total Factor Productivity Growth and its Determinants BSP Research Academy, June 2024.
Prudent Investor Newsletters:
When Free Lunch Politics Meets Fiscal Reality: Lessons from the DPWH Flood Control Scandal, Substack, September 07, 2025
The CMEPA Delusion: How Fallacious Arguments Conceal the Risk of Systemic Blowback, Substack, July 27, 2025
The Seen, the Unseen, and the Taxed: CMEPA as Financial Repression by Design, Substack, July 27, 2025
The Philippine Flood Control Scandal: Systemic Failure and Central Bank Complicity, Substack, October 05, 2025
The Political Economy of Corruption: How Social Democracy Became the Engine of Decay, Substack, October 26, 2025
BSP’s Gold Reserves Policy: A Precursor to a Higher USD-PHP Exchange Rate? Substack, March 03, 2025
How the BSP's Soft Peg will Contribute to the Weakening of the US Dollar-Philippine Peso Exchange Rate, Substack, January 02, 2025
June
2025 Deficit: A Countdown to Fiscal Shock, Substack, August 03, 2025