Bear Market Territory for the Third Time
The Philippine Phisix infringed on the bear market territory for the third time this year.
This week’s 4.12% meltdown, which adds to the other week’s 3.12% slump, has essentially expunged on the year’s earlier magnificent gains. The Phisix now stands at slightly off (-.78%) the same level it closed in 2012.
The recent selloffs has brought the local benchmark to close the week marginally below June lows and has been just slightly off the September lows based on the closing prices.
During the first bear market encroachment last June, the consensus alibied that market participants, particularly foreign investors, had “overreacted” and had been “irrational” in indiscriminately selling down emerging market equities. The Philippine Phisix according to some mainstream analysts suffered a case of mistaken identity via group classification.
Then I argued that due to such an outlook, we should expect violent denial rallies as most ‘bear market cycles’[1] have played out. (bold original)
“Denial” rallies are typical traits of bear market cycles. They have often been fierce but vary in degree. Eventually relief rallies succumb to bear market forces. The denial rally of 2007 virtually erased the August bear market assault but likewise faltered and got overwhelmed.History gives us clues but not certainties. The reason for this is that people hardly ever learn from their mistakes.From the above perspective, it would seem as perilous, dicey and mindless to disregard the potential adverse impact of the reappearance of the bear market that magnifies the risks of a transition towards a full bear market cycle.Unlike populist notions that bear markets have been devoid of “fundamentals”, bear market signals are symptoms of underlying pressures from maladjusted markets and economies or even strains from politics.
The latest episode of denial or “relief” rallies—as one would observe from the chart above as the rallies from point 1 to point 2 and from point 2 to point 3—has been notably fizzling out.
Based on chart patterns, the series of lower highs (dark and light blue trend lines) and a nearly horizontal base would seem like a continuing ‘bearish’ pattern called the descending triangle[2]. This means that even if we should see a rally from current levels, due to vastly oversold conditions, and if the bulls have indeed been losing ground, then the next rally will likely be even more limited in scale (and probably in duration too) than the previous 2 rallies before the next more intense downturn.
Should such scenario playout which implies of a building of downside momentum, then a breakdown of the support level at the 5,730s would seem imminent and decisive.
And such a breach would have the Phisix in tighter grip of the bears which likely means a transition into a full bear market cycle.
Of course the bulls can easily twist the interpretation of the above chart as a sign of a bullish “triple bottom”. Although this selective perception may be a possibility, the burden of proof lay on their shoulders. On the other hand, the path of least resistance has so far been tilted greatly in favor of the bears.
And I would like to also point out that there has been a stark difference between actions covering the June and September lows from today. In June and September, the Phisix experienced mini-crashes. Today, the decline in the Phisix has been gradual but has intensified over the last two weeks. In other words, the mini crashes in June and September has caught the bulls by surprise, thus the violent counterstrike via sharp relief rallies. The November-December decline seems to exhibit declining resistance in terms of vigor and stamina from the bulls.
I would add that I define a bear market strike as a dynamic where a security or a benchmark suffers a 20% decline over 2-3 months.
Following a breathtaking run in the Phisix where in one year or in 1993 the local equity benchmark yielded 154% in nominal currency returns, through 1994 to 1995 the Phisix endured three bear market strikes as part of the correction process.
The bears of 1994-1995 temporarily capitulated to the bulls where the latter staged a one year rally which recovered the 1993 highs. However the rally turned out to be short lived, as the bear market came back with a vengeance on the back of the emergence of the Asian crisis of 1997.
I am comparing with 1994-1997 than with 2007-2008 because the latter’s topping out process took up only 3 months.
Yet each bear market is unique.
The current episode reveals of one bear market strike but had 2 accounts of “denial or relief” rallies spread over 6 months. We may or may not see a third account of a denial rally.
Dr Marc Faber describes the transition of the topping process that led to the Asian crisis[3]:
The Asian Crisis of 1997-98 is also interesting because it occurred long after Asian macroeconomic fundamentals had begun to deteriorate. Not surprisingly, the eternally optimistic Asian analysts, fund managers, and strategists remained positive about the Asian markets right up until disaster struck in 1997.But even to the most casual observer it should have been obvious that something wasn't quite right. The Nikkei Index and the Taiwan stock market had peaked out in 1990 and thereafter trended down or sidewards, while most other stock markets in Asia topped out in 1994.In fact, the Thailand SET Index was already down by 60% from its 1994 high when the Asian financial crisis sent the Thai Baht tumbling by 50% within a few months. That waked the perpetually over-confident bullish analyst and media crowd from their slumber of complacency.
But unlike 1994-1997 topping process, which emanated from a very strong upside move pre-Asian, today’s transition may be a lot shorter.
The Fallacy of Fed Taper Equals Lower Markets
We should be reminded of the precious council from the legendary trader Jesse Lauristone Livermore[4],
It takes a man a long time to learn all the lessons of all his mistakes. They say there are two sides to everything. But there is only one side to the stock market; and it is not the bull side or the bear side, but the right side. It took me longer to get that general principle fixed firmly in my mind than it did most of the more technical phases of the game of stock speculation.
But not every man learns from their mistakes.
Three transgressions into the bear market boundary over the past 6 months yet we see the same degree of denials.
Through the week, the befuddled mainstream[5] has fixated on a single explanation: the post hoc fallacy (tautology) of the “Fed’s tapering equals falling Philippine stocks”.
The mainstream’s simplistic logic flows in the following manner:
a. Strong economy equals rising stocks.
b. Fed tapering equals falling stocks.
But if the stock market supposedly ‘represents’ on the conditions of the economy, which allegedly remains ‘strong’, then why should the Fed’s tapering be an inhibiting factor at all?
A sound of deafening silence follows.
This barely accounts for as economic reasoning but rather a heuristic one; particularly self-attribution bias error[6]—where people internalize success and blame failures on exogenous factors.
Yet there has hardly been any effort by mainstream media and their quoted experts to explain the self-contradiction in logic.
The Fed’s ‘supposed’ “tapering” will extrapolate to “lesser” liquidity in the global financial system. This means that if stocks are ‘sensitive’ to the liquidity conditions or if stock prices are driven by the liquidity generated by the central banks, particularly the US Federal Reserve only then will such stocks respond accordingly to changes in Fed’s policies.
Said differently what the mainstream implies is that with lesser liquidity, liquidity dependent stocks, like the Phisix and other emerging markets, has faltered. Translation: since Philippine stocks are highly dependent on the FED, then it is a bubble. This essentially is the kernel of their first premise.
Thus, the presumption that “Fed tapering equals falling stocks” signifies an implicit admission that Philippine stocks have been a central bank fueled bubble.
But the mainstream seems caught in a cognitive dissonance[7] dilemma of holding two contradictory ideas, values or beliefs in their analysis.
Since they believe that “strong economy equals rising stocks” then they expect that “tapering” to be temporary. In one of the stock market articles, despite the meltdown, one quoted expert expects the Phisix to close the yearend at 6,500.
With only about 9 trading days to go, this means that the said expert expects an average of 1.4% gains a DAY until the yearend. Is this a manifestation of realistic expectations or signs of desperate hope from an entrenched but misbegotten belief?
But how can the Fed’s “tapering” have a temporary effect on local stocks if indeed the latter has been chronically dependent on the former? And where does the strong economy come in?
Could it not be that the same dependence on liquidity conditions in stocks has likewise been the same dynamic enveloping the statistical economy? Why has Philippine money aggregates been exploding?
Yet contra the mainstream, I have been pointing out that global interest rates, as measured by bond yields, have been climbing even prior to the Fed’s taper talk. This has been evident in US Treasuries (UST) which has begun to rise in July 2012. The Fed’s QE 3.0 in September of 2012 only worked to forestall rising yields for only 3 months.
Rising bond yields could have been influenced by many or a combination of complex factors as mentioned a few weeks back[8], this includes pressures from the ongoing inflationary boom in US, Europe, China and elsewhere or its attendant erosion of real savings, this could also be signs of diminishing returns on central bank policies, the implied growth in inflation premium, an increase in credit risks in debt securities of deeply indebted governments, the Triffin dilemma or from a domestic perspective even as symptoms of homegrown bubbles. Thus the Fed’s taper, which serves as a convenient bogeyman or scapegoat, has been more of an aggravating factor rather than the root cause.
One only needs to look at how divergent the region’s performance have been
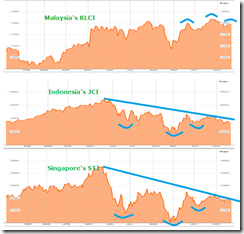
Among ASEAN’s equity markets, while the region’s equity markets have generally become weaker, the Philippine Phisix has grabbed the spotlight this week as the worst performer even compared with other Asian peers.
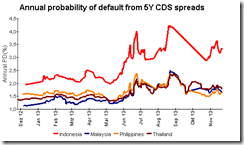
Yet Malaysia’s financial markets, including the equity bellwether, continue to defy the Fed taper gravity. In terms of currencies, the Indonesia’s rupiah seems as the worst performing as the USD-rupiah significantly broke past 12,000 (12,106 Friday close). In terms of bonds, Indonesia and Malaysia has underperformed.
Does this mean that in terms of equities, Malaysia has been seen as immune by the foreign money to the Fed’s taper? Does this also mean that the Philippines have been the most sensitive to the Fed’s taper as measured by the Phisix?
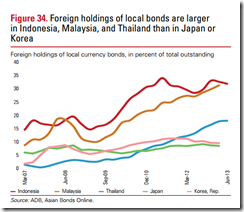
Yet Thailand, Korea and Indonesia, having the largest share of foreign money as % of market cap as of 2009, seem most vulnerable. Why then the relative underperformance by the Phisix?
While the Phisix may not be the worst performer in year-to-date, the Phisix among her contemporaries seems as the first in the region to have reached the June lows.
In the past, the bullish consensus has cheered foreigners as ‘rational’ and as ‘geniuses’ when they were seen as buying into the domestic stock market. Taper after all, for them, has allegedly been about foreign reallocation of portfolio.
Yet recently the same consensus has lambasted foreigners as ‘irrational’ for supposedly selling out on local equities. Yet if the Philippines has a ‘strong’ economy as alleged, that should deliver outsized relative returns, then why should foreigners sell the Philippine Stock Exchange (PSE)? Have foreigners been too obtuse to recognize of the potential profits from value buys based on supposedly sound fundamentals?
Such claims seem to have little basis. In November when the Phisix fell by 5.7% foreign money flowed into the PSE. According to the BSP, inflows to the PSE jumped by 84% year on year[9].
This means that if the BSP data is correct then foreigners have hardly been responsible for selling out on the Phisix. The local investors have been the culprit. Have the local experts been misrepresenting the role of foreigners when they themselves could be exiting the markets? A case of unethical pump and dump[10]—spread rosy but misleading information in order to sell one’s position?
However based on my tabulation of net foreign activities from PSE’s daily quotes, in November foreigners in contrast to the BSP’s posted a net selling of Php 4.96 billion pesos. This has been significantly less than October 2013 where the Phisix registered a strong advance of 6.35%. Yet whether the positive inflow of BSP data or my tally of PSE which shows slight negative flows, both actions point to locals as part of the panic-stricken sellers.
Fed Taper? Hardly.
Why not the Stagflation Story?
Based on sectoral performance, the burden of last week’s selloff has been centered mostly in the property sector and in far second spot, the financial sectors which are the most interest rate sensitive industries. What could have prompted such actions?
The BSP governor declares that a weak Peso won’t incite inflation[11] so he expects that the current policy regime to remain in place in 2014.
The Peso fell by .41% to 44.15 against the US dollar this week from last week’s 43.97.
Yet news reports say that in the National Capital Region (NCR) electricity bills will surge the most over the coming months[12].
With the approval of the Energy Regulatory Commission (ERC), Meralco will implement its highest power rate increase in December, February and March.
The Philippine Chamber of Commerce warned that such sharp series of hikes in electricity bills will “derail the growth of many power-intensive industries, particularly small and medium sized enterprises, and may even result in massive lay-offs”, according to the Inquirer[13].
After seeing a TV report of the proposed hike in public rail transport, my daughter rushed to me kvetching of what would remain of her allowance. I found out that the government via the Department of Transportation and Communication (DoTC) proposes to increase train fare by more than 50%[14]! The result of which has been to exacerbate street protests[15].
In BSP’s statistics, price inflation remains muted and largely irrelevant.
But in the real world we don’t ride, consume or eat statistics. Consumers and businesses appear to be reeling from the brunt of reckless central bank policies combined with political mandates which has been distorting the supply side, thus the increased incidences of unrest despite the BSP’s or the Philippine government’s denial.
As I wrote last week[16],
With soaring M3, which has been a symptom of excessive banking credit growth that has artificially been boosting demand for the first recipients of banking loans and for the initial beneficiaries of government spending in combination with mandates that induce supply imbalances, e.g. price controls, the Philippine government has put into place key ingredients for greater risks of stagflation regardless of what statistics say.
The risks of higher inflation which reallocates consumer’s pattern of spending will essentially reduce disposable income and consequently depress demand. On the supply side, rising input prices will compress on business and commercial profits in the face of declining demand thus adding to supply side constraints. This has prompted Philippine Chamber of Commerce to warn of electricity inflation as potentially derailing economic growth.
Yet more expansion of credit in the banking system will amplify on such imbalances.
I also noted last week that should price inflation continue to climb, this will eventually lead to higher interest rates. Aside from the Peso this will be revealed in the bond yields, despite denials by the BSP or by the banking system.
Yields of Philippine Local Currency 10 year bonds appear to have reacted modestly to recent news of energy and transport inflation by inching higher.
As a side note: The Philippine bond markets are illiquid, have very small foreign exposure and have been in tight control by the government and the banking system[17]. Since both benefit from low interest rates, thus the seeming thrust to keep interest rates at bay. However once runaway price inflation becomes apparent, regardless of the tightness of their control, the domestic bond markets which has been grotesquely mispriced, will eventually reflect on such inflation dynamics with significantly higher rates. This will unravel the convergence trade[18].
Artificially suppressed in interest rates represents a form of financial repression which serves as an implicit subsidy (from the loss of purchasing of consumers) to government debt via low interest rates. The low interest rate regime thus allows the government to go on a spending binge. Such spending spree has boosted the statistical economy that has spruced up approval ratings of the incumbent President. High approval ratings give leeway for the administration to implement her arbitrary ‘pet’ projects.
In addition, low interest rates redistribute resources from the real economy to those favored by the government and to the limited politically connected few, particularly those with access to the banking system.
Recent disclosures of energy and transport inflation appear to be signs of deepening manifestations of the growing risks of stagflation where eyes have been widely shut for the authorities and for those worshippers of the bubble economy.
So when the trifecta impact from stagflation hits the real economy, the result will be a sharp economic slowdown and or a bust in the bubble sectors.
In my view, the consensus appears to be deeply confounded with the key factors driving the domestic financial markets. Their devotion to statistics has led them amiss.
Bear Markets and the Real Economy
Just a short note on the economic impact of bear markets. Not all bear markets have a meaningful impact on the real economy. This would depend on many idiosyncratic factors.
The Philippine Phisix suffered a bear market in 2007-2008 but this has largely been due to the global contagion from the US crisis. Then the Philippines statistical GDP narrowly escaped a recession.
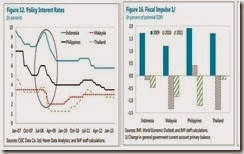
Reasons for this, one the Philippine central bank, the Bangko Sentral ng Pilipinas joined global central banks in adapting zero bound rates (left window).
Additionally the Philippine government along with many global and even regional governments implemented their domestic version of fiscal stimulus[19] (right window).
But I doubt that the 2007-8 conditions will replay today for one simple reason: An outgrowth of debt from the 2007-2008 policies.
The effect of the former has been to inflate credit bubbles that have juiced up the stock market and the property sector via bubbles in residential and commercial vertical condominium, the shopping mall and the casino (hotels).
The effect of the latter has been to keep nominal peso based government deficits at levels above pre-2009 (left) and an acceleration of the government’s debt levels (right). This implies that the relative high level of government budget had been partly financed by substantial increases in government borrowing.
And the potential consequence of a stagflationary regime will be to expose on the illusions of ‘good governance’, which has been cosmetically embellished by low interest rates, with the rapid ballooning of budget deficits and the dramatic expansion of debt to finance such deficits from a combination of factors such as lower tax revenues, bailouts and other political measures supposedly to “save” the economy.
The collapse of China’s stock market bubble in 2008 shares the same fate with the Philippines. China’s government launched a gigantic $586 billion economic stimulus program in 2008[20] which shielded her statistical economy from a recession. But this has only shifted her stock market bubble to the real economy by virtue of the intensification of the property sector bubble backed by a huge shadow banking industry now estimated at US $4.7 trillion[21].
China’s massive credit bubble remains as one of the proverbial Damocles Sword over the global economy.
San Miguel’s Debt in-Debt out; the risks of Breaking the Buck
Since I see SMC as a source of systematic risk or a general risk in the financial system rather than merely a corporate or industry specific non-systematic risk, I have my eyes on her.
SMC’s sale of Meralco shares to JG Summit was executed at the Philippine stock exchange board last Wednesday December 11th 2013[22]. The total amount of the special block sale was at Php 72.041 billion.
Let us first put aside SMC’s sale of MER.
As of the third quarter[23], SMC’s ‘debt in-debt out’ has accrued to a whopping Php 801 billion as I noted last week. This represents a 48% jump from the second quarter and about the same amount of debt turnover for the entire 2012.
Php 801 billion over 9 months represents Php 89 billion a month. Assuming that SMC won’t add more to the rate of her debt turnover growth and will apply the same rate until the yearend, SMC will close this year with a colossal Php 1.068 trillion!
SMC’s Php 1.068 trillion pesos of debt turnover accounts for a startling 11.68% of the Php 9.138 trillion worth of assets of the entire Philippine banking system as of September 2013[24]! Just one company playing with fire with about 10% of the Philippine banking system. Of course some of these indentures have been via the capital markets through bonds.
Yet if the amount of debt churning has been expanded, then this means SMC will easily surpass the Php 1.1 trillion mark at the close of 2013
To put into perspective, the Php 1.1 trillion threshold will represent almost SMC’s total declared asset Php 1.165 trillion as of the third quarter. SMC’s assets are based on “market observable prices”[25] according to SMC’s 3rd quarter financial statement. In short, boom time prices tend to bloat SMC assets.
The same applies to equity. According to SMC, interest rate movements affect retained earnings via interest income and expenses, the fair value of reserves and hedging reserves[26].
Foreign exchange also affects equity in the context of retained earnings, comprehensive income and hedging reserves[27].
In short, changes in interest rates and forex rates will have material impact on SMC’s equity. Thus any dramatic change in both of these indicators may tend to prompt for a decline in the equity and in asset valuations relative to the massively burgeoning debt.
Let us incorporate the Php 72.041 billion MER sale.
Seen from ‘debt in-debt out’ perspective, Php 72 billion signifies a drop in the bucket or barely even enough to cover the monthly $89 billion amount debt turnover. I am not sure whether SMC will apply all the proceeds to reduce the equivalent amount in total debt or just part of it or will just be consumed by one month of debt turnover.
Whatever route SMC takes, it would seem that the MER sale will easily be eclipsed by soaring debt turnover.
Importantly, it has been a curiosity for me to establish how SMC’s finances her humongous short term liquidity requirements.
According to her 3rd quarter financial statement SMC has “a committed stand-by credit facility from several local banks is also available to ensure availability of funds when necessary. The Group also uses derivative instruments such as forwards and swaps to manage liquidity”[28]
In other words, many banks may be unduly exposed to SMC’s massive pileup of short term debt.
In the culmination of the 2008 US mortgage crisis, when Lehman Bros filed for bankruptcy, the US money market seized up when a wave of redemptions prompted for the failure of Reserve Primary fund to maintain her net asset value (NAV) at par or above the US $1 per share[29]. This caused a liquidity crisis known as “breaking the buck” particularly for many non-US banks heavily reliant on US wholesale markets. Unlike typical retail depositor led bank runs, the 2008 “breaking the buck” was a bank run on the shadow banking industry[30] or essentially on wholesale deposits by institutional investors in the face of deteriorating conditions in the market particularly deleveraging and or de-risking[31]
The lesson from the Lehman episode is that if and when for any reason any of SMC’s short term liquidity provider/s stalls or even merely loses confidence, SMC’s debt churning risks morphing into a massive liquidity crunch that may provoke a system wide dislocation. I don’t know if the BSP even recognizes this.
In my view, the reason why SMC management continues to play the high roller’s game could be that they may be expecting a bailout in case things may go wrong. Yes political moral hazard. Unfortunately if events do go astray, there may be ripples of intractable credit dislocations which may surprise the government.
I hope I am wrong that this will not transform into a systemic risk. But the debt turnover numbers so far have been growing at an astounding rate.
For now, for as long as the low interest rate music keeps playing, to borrow from Citibank’s former chairman and chief executive Charles Prince, SMC’s creditors will keep dancing.
Holiday Greetings and Wishes
The bear market in the Phisix is a personal bad news for me for the simple reason that this paves way for prolonged income drought or famine for me and particularly for those who entirely rely on trading, stock market investment and commissions for livelihood. This will also be bad news for the industry.
Though the PSE has short facilities, such facility looks impotent and inaccessible as this has been mired with a horrible web of regulations as explained to me by my principals. This seeming one way route for investing is one of the main causes why the mainstream has been blind to risks which has incentivized industry players to see only one direction for the stock markets—it’s the only way to make money.
I have tried to hedge my significantly reduced equity exposure with foreign currency trade by shorting the Philippine Peso. Beginners luck granted me a 180% floating return due to high leverage, but when the Bernanke led FED declared an UN-taper last September, the whole gain vanished in just 2-3 days where I closed my position with an 8% realized loss as my baptism of fire in currency trading. My intention then was to take a long term position on a short Philippine Peso-long US dollar trade. Unfortunately adding to the cost of trade has been the significant swap rate fees for maintaining overnight positions.
Also the wildly volatile short term oriented currency trading has hardly any room for errors. If one happens to be in a wrong place in a wrong time, one would have to take unnecessary losses even if one’s long term perspective has been correct. Chart reading seems as hardly a big help in the face of the highly mercurial currency markets.
Nonetheless having learned of the agency problem from the economic and philosophic perspective, I did my best to deal with industry in what I see as a professional manner and will continue to do so.
My position to take on the objective and contrarian stance has been aimed at providing protection to the investment positions of my clients, my principal’s clients, my principals, my readers and for those whom has learned to put their trust on me—by informing them of tradeoffs between risks and rewards amidst the changes in the risk profile dynamic of the marketplace as time evolves.
Though my perspective has been unorthodox, occasionally this comes with the social costs of unpopularity. Yet in today’s environment the return OF capital will be more of importance than the return on investments (ROI), so it doesn’t matter if one’s position is popular or not what matters is to preserve capital
In heeding the wisdom of the former value investor Warren Buiffett who once said[32],
You can't do well in investments unless you think independently. And the truth is, you're neither right nor wrong because people agree with you. You're right because your facts and your reasoning are right. In the end that's all that counts. And there wasn't any question about the facts or reasoning being correct.
Yet my primary objective has been to think and reason 'out of the box' and 'ahead of the curve'.
I do hope that my writings have helped in anyway to preserve your capital.
As this is my final note for the year, I would like to wish you a Merry Xmas and a Healthy, Fruitful, Happy, Capital Preserving New Year.
In liberty,
Benson
[1] See Phisix: Don’t Ignore the Bear Market Warnings June 30, 2013
[2] Investopedia.com Descending Triangle
[3] Dr. Marc Faber, The Financial Crisis Was No Accident DailyReckoning.com December 4, 2013
[4] Jesse Livermore via Edwin Lefevre REMINISCENCES OF A STOCK OPERATOR, Chapter 3, Nowandfutures.com
[5] Inquirer.net Market enters bear territory December 10, 2013; Inquirer.net PH market stays in bear territory December 12, 2013; Inquirer.net Stocks rise slightly on bargain-hunting December 13, 2013
[6] Wikipedia.org Attribution bias
[7] Wikipedia.org Cognitive dissonance
[8] See Phisix: Are ASEAN Markets Signalling Trouble?; More on Typhoon Yolanda November 25, 2013
[9] Bangko Sentral ng Pilipinas Foreign Portfolio Investments Yield Net Inflows in November December 13, 2013
[10] Investopedia.com Pump And Dump
[11] Bloomberg.com Philippine Peso’s Weakness Won’t Spur Inflation, Tetangco Says December 13, 2013
[12] Inquirer.net Power hike shocks users December 10, 2013
[13] Inquirer.net Rate hike may stunt growth in Meralco areas December 13, 2013
[14] Inquirer.net DOTC seeks ‘P11 + 1’ fare hike scheme December 12, 2013
[15] Inquirer.net Protests greet LRT, MRT consultation on fare hikes December 12, 2013
[16] See Phisix: Escalating Risks from the Region and from Internal Bubbles December 9, 2013
[17] See Phisix: Has ASEAN Bear Markets Been Signaling a Crisis? September 2, 2013
[18] See Phisix: The Convergence Trade in the Eyes of a Prospective Foreign Investor November 11, 2013
[19] Agnes Isnawangsih, Vladimir Klyuev, Longmei Zhang The Big Split: Why Did Output Trajectories in the ASEAN-4 Diverge after the Global Financial Crisis? IMF Working paper October 2013
[20] Wikipedia.org Chinese economic stimulus program
[21] See Fitch Defies S&P on China’s Credit Bubble May 29 2013
[22] PSE.com.ph Sale of MER shares to JGS December 11, 2013
[23] PSE.com.ph SMC SEC form 17-Q as of September 30, 2013 November 14, 2013
[24] Bangko Sentral ng Pilipinas BALANCE SHEET AND KEY RATIOS
[25] PSE.com.ph SMC op.cit p.26
[26] PSE.com.ph SMC op.cit p.15
[27] PSE.com.ph SMC op.cit p.19
[28] PSE.com.ph SMC op.cit p.31
[29] Jeanne Gobat Breaking the Buck—Reducing Systemic Risks Posed by Money Market Mutual Funds IMF Blog direct November 10, 2010
[31] Mark Hannam Money Market Funds, Bank Runs and the First-Mover Advantage p.15 Institutional Money Market Fund Association January 2013
[32] CNN Money.com The Oracle of Everything Warren Buffett has been right about the stock market, rotten accounting, CEO greed, and corporate governance.The rest of us are just catching on November 11, 2002


