Showing posts with label reserve requirements. Show all posts

Sunday, August 31, 2025

Goldilocks Meets the Three Bad Bears: BSP’s Sixth Rate Cut and the Late-Cycle Reckoning


Perhaps more than anything else, failure to recognize the precariousness and fickleness of confidence—especially in cases in which large short-term debts need to be rolled over continuously—is the key factor that gives rise to the this-time-is-different syndrome. Highly indebted governments, banks, or corporations can seem to be merrily rolling along for an extended period, when bang!, confidence collapses, lenders disappear, and a crisis hits—Carmen Reinhart and Kenneth Rogoff 

In this Issue 

Goldilocks Meets the Three Bad Bears: BSP’s Sixth Rate Cut and the Late-Cycle Reckoning

I. The BSP’s Sixth Cut and the Goldilocks-Sweet Spot Illusion

II. Data-Driven or Dogma-Driven? The Myth of Low-Rate Growth

III. The Pandemic Rescue Template Returns, The MSME Credit Gap

IV. Fintech’s Limits, Financial Concentration: Banking Cartel by Design

V. Treasury Market Plumbing: Who Really Benefits?

VI. Crowding Out: Corporate Issuers in Retreat

VII. The Free Lunch Illusion: Debt and Servicing Costs

VIII. Banks as the Heart of the Economy: Palpitations in the Plumbing

IX. Q2 2025 Bank Profit Plummets on Credit Loss Provisions

X. Conclusion: Goldilocks Faces the Three Bad Bears 

Goldilocks Meets the Three Bad Bears: BSP’s Sixth Rate Cut and the Late-Cycle Reckoning 

The Bangko Sentral ng Pilipinas’ latest rate cut is a "Goldilocks" illusion masking a late-cycle reckoning driven by crowding out, surging leverage, and mounting stress in the financial system 

I. The BSP’s Sixth Cut and the Goldilocks-Sweet Spot Illusion 

Reinforcing its "easing cycle," the Bangko Sentral ng Pilipinas (BSP) cut policy rates last week—the sixth reduction since August 2024. Officials claimed they had reached a “sweet spot” or “Goldilocks level”—a rate neither inflationary nor restrictive to growth, as the Inquirer reported

We’ve used “sweet spot” before, but not as a compliment. In our framing, it signals ultra-loose monetary policy—part of a broader “Marcos-nomics stimulus” package that fuses fiscal, monetary, and FX regimes into a GDP-boosting mirage. A rescue narrative sold as reform. 

II. Data-Driven or Dogma-Driven? The Myth of Low-Rate Growth 

The idea that “low rates equal growth” has calcified into public gospel

But if that logic holds, why stop at 5%? Why not abolish interest rates altogether—and for good measure, tax 100% of interest income? By that theory, we’d borrow and spend our way to economic utopia. In short: Such (reductio ad absurdum) logic reduces policy to absurdity: prohibit savings, unleash debt, and expect utopia.


Figure 1

The BSP insists its decisions are data-driven. But have they been? Since the 1998 Asian Crisis, rate cuts have been the default posture. 

And since the 2007–2009 Global Financial Crisis, each successive cut has coincided with slowing headline GDP—through the pandemic recession and beyond. The decline was marginal at first, barely noticed. But post-pandemic, the illusion cracked. (Figure 1 upper pane)

A historic rescue package—Php2.3 trillion in injections, rate cuts, RRR reductions, a USD-PHP soft peg, and sweeping relief measures—combined with unprecedented deficit spending, triggered a temporary growth spike. This extraordinary intervention, combined with global reopening, briefly masked structural weaknesses. 

But since 2021, GDP has resumed its downward drift, with the deceleration becoming conspicuous through Q2 2025. Inflation forced the BSP to hike rates, only to restart its easing cycle in 2024. 

So where is the evidence that low rates boost the economy?

III. The Pandemic Rescue Template Returns, The MSME Credit Gap 

Today’s “sweet spot” eerily mirrors the pandemic-era rescue templateminus the direct injections and relief measures. For now. 

Meanwhile, over half the population still self-identifies as borderline or poor (self-rated poverty surveys—SWS and OCTA). 

GDP, as a measure, fails to capture this disconnect—possibly built on flawed inputs, questionable categorization and assumptions, as well as politically convenient calculations. 

Meanwhile, the BSP’s easy money regime and regulatory bias have allowed banks to monopolize the financial system, now accounting for 83% of total financial assets as of Q2 2025. (Figure 1, lower graph) 

Yet MSMEs—the backbone of employment at 67% (as of 2023, DTI)—remain sidelined. 

Ironically, Republic Act No. 9501 mandates banks to lend 10% of their portfolio to MSMEs (8% to micro and small, 2% to medium enterprises).


Figure 2

But compliance has collapsed—from 8.5% in 2010 to just 4.63% in Q1 2025. (Figure 2, topmost image) 

Banks, unable to price risk appropriately, prefer paying penalties over lending to the sector. The result: the credit boom inflating GDP primarily benefits 0.37% of firms—the large enterprises that employ only a third of workers. 

While RA 9501 mandates banks to allocate 10% of their loan portfolio to MSMEs, BSP regulations restrict risk-based pricing—directly through caps on consumer and financing loans (BSP Circular 1133) and indirectly in MSME lending through microfinance rules (Circulars 272, 364, 409, and related issuances).   

Again, unable to fully price in higher default risks, banks often find it cheaper to pay penalties than to comply. 

IV. Fintech’s Limits, Financial Concentration: Banking Cartel by Design 

At the same time, banks are aggressively expanding into consumer credit, while the unbanked majority continues to rely on the informal sector at usurious or punitive rates. 

Fintech e-wallets have gained traction, but they remain mostly transactional platforms. Banks, by contrast, are custodial institutions. Even if convergence is inevitable, bridging the informal credit gap will remain elusive unless rates reflect real distribution and collection risks.

This convergence may democratize leverage—but banks still dominate credit usage, reinforcing a top-heavy system

Deepening concentration, paired with price restrictions, resembles a cartel. A BSP-led cartel. 

And the first beneficiaries of this low-rate regime? Large enterprises and monied consumers. 

V. Treasury Market Plumbing: Who Really Benefits? 

And like any cartel, it relies not only on market power but also on control of the pipes—the very plumbing of the financial system, now evident in the Treasury market 

The Bangko Sentral ng Pilipinas has dressed up its latest rate cut as part of a “Goldilocks easing cycle,” but the bond market tells a different story.

Even before the policy shift, the Philippine BVAL Treasury yield curve had been flattening month after month, with long rates falling faster than the front end.  (Figure 2, middle and lower charts) 

That is not a picture of renewed growth but of markets bracing for a slowdown and disinflation. 

The rate cut simply ratified what the curve had preemptively declared: that the economy was softening, and liquidity needed to be recalibrated.


Figure 3

From the Treasury market’s perspective, the real beneficiaries weren’t households or corporates—they were institutional actors navigating a crowded, distorted market. 

Trading volumes at the Philippine Treasury market raced to all-time highs in August, just before and during the cut! (Figure 3, topmost diagram) 

This wasn’t retail exuberance—it was plumbing. 

BSP’s direct and indirect liquidity injections, coupled with foreign inflows chasing carry (data from ADB Online) amid global easing and macro hedges created a bid-heavy environment. The rate cut amplified this dynamic, lubricating government borrowing while sidelining private credit. (Figure 3, middle visual) 

VI. Crowding Out: Corporate Issuers in Retreat 

Meanwhile, the collateral damage is clear: corporate bond issuance has been trending downward, regardless of interest rate levels—both in nominal terms and as a share of local currency debt. (Figure 3, lowest window) 

This is evidence of the crowding-out syndrome, which suggests that BSP easing isn’t reviving private investment—it’s merely accommodating fiscal expansion

In the cui bono calculus, the winners of rate cuts are clear: the state, the banks, and foreign macro hedgers. 

The losers? Domestic firms, left behind in a market—where easing no longer means access. 

VII. The Free Lunch Illusion: Debt and Servicing Costs


Figure 4

The deeper reason behind the BSP’s ongoing financial plumbing lies in social democracy’s favorite illusion: the free lunch politics

Pandemic-era deficit spending has pushed public debt to historic highs (Php 17.27 trillion in June), and with it, the burden of debt servicing. (Figure 4, topmost chart) 

July’s figures—due next week—may breach Php 17.4 trillion. 

Even with slower amortizations temporarily easing the burden in 2025, interest payments for the first seven months have already set a record.

Rising debt means rising servicing obligations—even at the zero bound. The illusion of cheap debt is just that: an illusion. 

Crowding out isn’t just theoretical. 

It’s visible in the real economy—where MSMEs and half the population (per self-poverty surveys) are squeezed—and in the capital markets, where even the largest firms are feeling the pinch. 

The entropy in financial performance among PSE-listed firms, especially the PSEi 30, underscores that the spillover has reached even the politically privileged class. (see previous discussion—references) 

Monthly returns of the PSEi 30 similarly reflect the waning impact of the BSP’s cumulative easing measures since 2009. (Figure 4, middle image) 

In a world of scarcity, there is no such thing as a permanent free lunch. 

VIII. Banks as the Heart of the Economy: Palpitations in the Plumbing 

If the government is the brain of the political economy, banks are its heart. And the pulse is showing increasing signs of palpitations.

The banking system’s books reveal the scale of the plumbing, most visible in the record-high net claims on central government (NCoCG) held by the banking system and Other Financial Corporations (OFCs). 

Bank NCoCG surged 7.5% YoY to an all-time high Php 5.591 trillion in Q2 2025, pushing Held-to-Maturity (HTM) assets up 1.8% YoY to a milestone Php 4.075 trillion. (Figure 4, lowest graph)


Figure 5 

OFCs saw an even sharper jump—14.7% in Q1 to a record Php 2.7 trillion! (Figure 5, topmost diagram) 

According to the BSP, OFCs are composed of non-money market investment funds, other financial intermediaries (excluding insurance corporations and pension funds), financial auxiliaries, captive financial institutions and money lenders, insurance corporations, and pension funds. 

Yet despite these massive reallocations—and even with banks drawing a staggering Php 189 billion from their freed-up reserves (Claims on Other Depository Corporations) after March’s RRR cut—liquidity remains tight. (Also discussed last August, see references) (Figure 5, middle chart) 

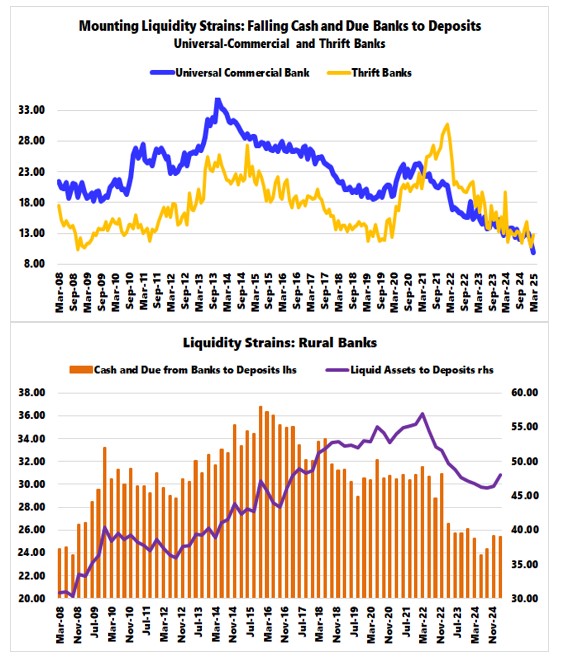
Cash reserves continue to decline. Though cash-to-deposit ratios bounced in June from May’s all-time low, the trend remains downward—accelerating even as RRR rates fall to 5%. (Figure 5, lowest image) 

Liquid assets-to-deposit ratios have slumped to levels last seen in May 2020, effectively nullifying the supposed benefits of the BSP’s Php 2.3 trillion pandemic-era injections. 

This strain is now reflected in bank stocks and the financial index—dragging down the PSE and the PSEi 30. 

Goldilocks, eh? 

After the rate cut, the BSP immediately floated the possibility of a third RRR reduction—“probably not that soon.” Highly doubtful. Odds are it lands in Q4 2025 or Q1 2026. 

But even if the BSP dismantles the Reserve Requirement entirely, unless it confronts the root cause—the Keynesian dogma that credit-financed spending is a growth elixir—the downtrend will persist. 

At zero RRR, the central bank will run out of excuses. And the risk of bank runs will amplify.

IX. Q2 2025 Bank Profit Plummets on Credit Loss Provisions


Figure 6 

The toll on banks is already visible—profits are unraveling. From +10.96% in Q1 to -1.96% in Q2.  (Figure 6, upper visual) 

The culprit? 

Losses on financial assets—driven by surging provisions for credit losses, which ballooned 89.7% to Php 43.78 billion in Q2. That’s pandemic-recession territory—December 2020. (Figure 6, lower graph) 

X. Conclusion: Goldilocks Faces the Three Bad Bears 

The cat is out of the bag. 

The “stimulative effect” is a political smokescreen—designed to rescue banks and the elite network tethered to them. It’s also a justification for continued deficit spending and the rising debt service that comes with it. 

But “sweet spots” don’t last. They decay—subject to the law of diminishing returns. 

Paradoxically, under the Goldilocks fairy tale, there were three bears. In our case: three ‘bad’ bears:

  • Crowding out and malinvestments
  • Surging systemic leverage
  • Benchmark-ism to sanitize worsening fundamentals 

Even the Bank for International Settlements has quietly replaced Philippine real estate pricing bellwethers with BSP’s version—one that paints booming prices over record vacancies. 

Nonetheless, the bears are already in the house. The porridge is cold. And the bedtime story is over. What remains is the reckoning—and the question of who’s prepared to face it without the comfort of fairy tales 

All signs point to a late-stage business cycle in motion. 

___

references 

Prudent Investor Newsletters, Q2–1H Debt-Fueled PSEi 30 Performance Disconnects from GDP—What Could Go Wrong, August 24, 2025 Substack 

Prudent Investor Newsletters, Philippine Banks: June’s Financial Losses and Liquidity Strains Expose Late-Cycle Fragility, August 17, 2025 Substack


Sunday, May 18, 2025

Liquidity Under Pressure: Philippine Banks Struggle in Q1 2025 Amid a Looming Fiscal Storm


Truth always originates in a minority of one, and every custom begins as a broken precedent—Nancy Astor 

In this issue: 

Liquidity Under Pressure: Philippine Banks Struggle in Q1 2025 Amid a Looming Fiscal Storm

I. Introduction: A Financial-Political Economic System Under Increasing Strain

II. Liquidity Infusion via RRR Cuts: A Paradox: Declining Cash Amid Lending Boom

III. Mounting Liquidity Mismatches: Slowing Deposits Amid Lending Surge, Liquidity Ratios Flashing Red

IV. Government Banks and Broader Financial Systemic Stress

V. Mounting Liquidity Mismatches: Record Surge in Bank Borrowings and Repo Market Heats Up

VI. RRR Cuts as a Lifeline, Not Stimulus, Why the Strain? Not NPLs, Not Profitability

VII. Bank-Financial Index Bubble and Benchmark-ism: Disconnect Between Profit and Market Valuation

VIII. Financial Assets Rise, But So Do Risks; Spotlight on Held-to-Maturity Assets (HTM); Systemic Risks Amplified by Sovereign Exposure

IX. Brace for the Coming Fiscal Storm

X. Non-Tax Revenues: A High Base Hangover; Rising Risk of a Consecutive Deficit Blowout

XI. April 2025 Data as a Critical Clue of Fiscal Health

XII. Aside from Deficit Spending, Escalating Risk Pressures from Trade Disruptions and Domestic Economic Slack

XIII. Final Thought: Deepening Fiscal-Bank Interdependence Expands Contagion Risk Channels 

Liquidity Under Pressure: Philippine Banks Struggle in Q1 2025 Amid a Looming Fiscal Storm 

Behind the balance sheets: why Philippine banks are bleeding cash even as lending accelerates—and what the looming fiscal blowout means for systemic risk. 

I. Introduction: A Financial-Political Economic System Under Increasing Strain

We begin our analysis of the Philippine banking system in Q1 2025 with our April assessment:

"However, the data suggests a different story: increasing leverage in the public sector, elite firms, and the banking system appears to be the real driver behind the BSP’s easing cycle, which also includes RRR reductions and the PDIC’s doubling of deposit insurance. 

"The evidence points to a banking system under strain—record-low cash reserves, a lending boom that fails to translate into deposits, and economic paradoxes like stalling GDP growth despite near-record employment." (Prudent Investor, April 2025) [bold italics original] 

The Bangko Sentral ng Pilipinas (BSP) released pivotal data in its April 2025 Central Bank Survey (MAS) and an updated balance sheet and income statement for the Philippine banking system. 

The findings reveal a sector grappling with severe liquidity constraints despite aggressive monetary easing. 

This article dissects these challenges, exploring their causes, implications, and risks to financial stability, while situating them within the broader economic and fiscal landscape. 

II. Liquidity Infusion via RRR Cuts: A Paradox: Declining Cash Amid Lending Boom 


Figure 1

The second leg of the BSP’s Reserve Requirement Ratio (RRR) reduction in March 2025 resulted in a Php 50.9 billion decrease in liabilities to Other Depository Corporations (ODCs) by April. 

When combined with the first RRR cut last October, the cumulative reduction from October to April amounted to a staggering Php 429.4 billion—effectively unleashing nearly half a trillion pesos of liquidity into the banking system via freed-up cash reserves. (Figure 1, topmost window) 

Even more striking was the BSP’s March report on the balance sheets of Philippine banks. The industry's "cash and due from banks" dived 28.95% year-on-year, from Php 2.492 trillion in 2024 to Php 2.09 trillion in 2025—its lowest level since at least 2014! (Figure 1, middle graph) 

This sharp drop calls into question the effectiveness of RRR cuts while also exposing deeper structural issues within the banking system. 

Ironically, this cash drain occurred alongside a robust expansion in bank lending. Yet, deposit growth stalled, which further strained liquidity and weighed on money supply growth. 

The limited impact of RRR reductions may reflect banks using freed-up reserves to cover existing liquidity shortfalls rather than fueling new lending or deposit growth. 

Meanwhile, the BSP’s move to double deposit insurance through the Philippine Deposit Insurance Corporation (PDIC) last March—nearly coinciding with the second phase of the RRR cut—signals growing concerns over depositor confidence, potentially foreshadowing broader financial stability risks 

III. Mounting Liquidity Mismatches: Slowing Deposits Amid Lending Surge, Liquidity Ratios Flashing Red 

The decline in cash reserves coincided with decelerating deposit growth, even as bank lending surged

Deposit liabilities growth fell to just 5.42% in March—its lowest since August 2019. The deceleration was mainly driven by a slowdown in peso deposits growth, from 6.28% in February to 5.9% in March. Foreign currency (FX) deposits also remained a drag, despite a modest improvement from 2.84% to 3.23%. (Figure 1, lowest diagram) 

In stark contrast, the banking sector’s total net lending portfolio (inclusive of RRPs and IBLs) surged to 14.5% in March from 12.31% in February.

Figure 2 

As a result, the ratio of "cash and due from banks" to total deposits has collapsed to 10.37% in March 2025, levels below those seen in 2013—underscoring an escalating liquidity mismatch! (Figure 2, upper pane) 

This divergence highlights a critical tension: despite BSP’s aggressive monetary easing, lending is not translating into deposit growth. Instead, it has created a liquidity conundrum—intensifying balance sheet strain. 

Beyond cash, the liquid assets-to-deposits ratio has fallen back to levels last seen in April 2020, effectively reversing the gains achieved during the BSP’s pandemic-era historic liquidity rescue. 

This indicates a depletion of liquid assets—comprising cash and net financial assets excluding equities—which are crucial for meeting withdrawal demands and regulatory requirements, making this decline a critical vulnerability. 

Curiously, cash positions reported by publicly listed banks on the PSE showed a 4.43% YoY increase, with only five of the 16 banks reporting a cash decline. This apparent contradiction prompted deeper scrutiny. (Figure 2, lower table) 

The divergence between lending and deposit growth indicates a breakdown in the money multiplier effect, where loans typically generate deposits as borrowers spend. 

Two critical factors likely driving the erosion of savings. 

First, steep competition arising from the financing crowding-out effect of government borrowing (via record deficit spending), which competes with banks and the non-financial sector for access to public savings, has been a key force in suppressing savings. 

Second, extensive debt accumulation from malinvestments in 'build-and-they-will-come' sectors further consumes savings and capital, exacerbating the decline. 

IV. Government Banks and Broader Financial Systemic Stress 

Our initial suspicion pointed to government banks (DBP and LBP) as potential sources of the cash shortfall.

Figure 3

However, BSP data revealed that liquidity pressures were widespread—not only affecting universal and commercial banks but also impacting thrift and rural-cooperative banks.  (Figure 3) 

Interestingly, these smaller banking institutions (rural-cooperative banks) displayed relatively better liquidity positions than their larger peers. 

This discrepancy could reflect differing reporting standards between disclosures to the public and to the BSP. 

Diverging indicators could also signal "benchmark-ism"—where worsening problems are obscured through embellished reporting. 

V. Mounting Liquidity Mismatches: Record Surge in Bank Borrowings and Repo Market Heats Up 

Another red flag is the record-high bank borrowing.

Figure 4

Total bank borrowings soared by 40.3% in March to an all-time high of Php 1.91 trillion. This pushed the borrowing-to-liabilities share to 7.89%—its highest level since the pandemic’s onset in March 2020. (Figure 4, topmost chart) 

The sharp rise was driven by bills payable, which skyrocketed by 65.4% in March. 

In contrast, bonds payable grew by just 4.12%. As a result, bills payable now make up 5.5% of total liabilities—almost double the 2.9% share of longer-term bonds. (Figure 4, middle image)

This asymmetry is mirrored in listed banks’ financials. Excluding BPI (which lumps bills under "other borrowed funds"), bills payable surged by 69.4% in Q1 2025 to Php 1.345 trillion. 

MBT alone reported a 214% increase to Php 608 billion—representing 45.21% of the aggregate from PSE-listed banks. 

Repo transactions also surged in March. (Figure 4, lowest diagram) 

Interbank repos hit an all-time high, while repo trades with the BSP reached the third highest level on record. This reflects increasing reliance on short-term funding mechanisms, a hallmark of tightening liquidity conditions. 

This reliance on short-term borrowing for bridge financing, while cost-effective in the near term, exposes banks to refinancing risks, particularly if interbank rates rise or market confidence falters. 

All this underscores that liquidity stress is not confined to a single quarter—it is deeply embedded in bank balance sheets. 

VI. RRR Cuts as a Lifeline, Not Stimulus, Why the Strain? Not NPLs, Not Profitability 

In hindsight, both legs or phases of the RRR cut were not preemptive monetary tools but reactive measures aimed at alleviating a growing liquidity crisis. 

Similarly, rate cuts—intended to reduce borrowing costs—only served to expose the structural weaknesses in the banking system.


Figure 5

According to the BSP, credit delinquency improved in March, with Gross and Net Non-Performing Loans (NPLs) as well as Distressed Assets showing a slight decline. (Figure 5, topmost pane) 

Indeed, the banking system posted a 10.6% YoY increase in Q1 2025 profits—better than last year’s 2.95%, but still significantly weaker than 2022–2023. It was also a deceleration from Q4’s 20.7%. 

While the profit rebound is positive, it may be artificially inflated by 'accounting acrobatics.' The slowdown relative to 2022–2023 suggests diminishing returns from lending—driven by weaker borrower demand, rising unpublished NPLs, or both.’

VII. Bank-Financial Index Bubble and Benchmark-ism: Disconnect Between Profit and Market Valuation 

Despite slowing profit growth, the PSE’s Bank dominated Financial Index continued to hit record highs in Q1 and into May 2025. This signals a disconnect between bank valuations and their actual financial or ‘fundamental’ performance. (Figure 5, middle graph) 

This growing divergence may reflect "benchmark-ism"—where inflated share prices are used to mask the sector’s internal fragilities, as previously discussed

Despite a sharp slowdown in revenue growth (10.37% vs. 24% in 2024), listed banks still posted a 7.5% increase in ‘accounting profits.”  (Figure 5, lowest diagram) 

In theory, profits should enhance liquidity, not diminish it—unless those profits are largely cosmetic—"benchmark-ism." 

For investors, the divergence between stock performance and fundamentals signals caution, as inflated valuations could unravel if liquidity pressures escalate

VIII. Financial Assets Rise, But So Do Risks; Spotlight on Held-to-Maturity Assets (HTM); Systemic Risks Amplified by Sovereign Exposure 

The rapid contraction in cash reserves cannot be fully attributed to lending, NPLs, or financial asset growth.


Figure 6

Bank financial assets (net) rose 11.8% to an all-time high of Php 7.89 trillion in March. Accumulated unrealized losses narrowed from Php 26.4 billion to Php 21.04 billion. (Figure 6, topmost chart) 

Instead, held-to-maturity (HTM) assets, primarily government securities, offer insight. 

After a period of stagnation, HTMs grew 1.7% in March—breaking the Php 4 trillion ceiling (since 2023) to reach a new high of Php 4.06 trillion. (Figure 6, middle image) 

Despite lower interest rates, banks have not pared back HTM holdings. That’s because most HTMs are composed of government securities, particularly "net claims on the central government" (NCoCG), which surged to a record Php 5.58 trillion in March. (Figure 6, lowest diagram) 

This spike aligns with the record Q1 fiscal deficit—and likely presages a similarly wide Q2 deficit.

IX. Brace for the Coming Fiscal Storm 

As we’ve consistently argued, rising sovereign risk will amplify the banking system’s fragility. 

A blowout fiscal deficit won’t just expose skeletons—such as questionable accounting practices used to inflate profits, understate NPLs, or distort share prices—it will likely push the BSP toward a more aggressive role in stabilizing the financial system. 

This intervention could have sweeping implications for financial markets and the broader economy.


Figure 7

The public and the market's complacency over the government's deteriorating fiscal position has been astonishing. 

In Q1 2025, a steep revenue decline triggered a record fiscal deficit blowout—comparable to historical first-quarter data. As a result, the deficit-to-GDP ratio surged to 7.3%, far above the government’s full-year target of 5.3% (DBCC). (Figure 7, topmost window) 

Markets have largely dismissed these data, buoyed by two ‘available bias’ heuristics: the midterm election cycle and a steady stream of official reassurances

Yet it is worth underscoring: the 7.3% deficit-to-GDP ratio masks the extent of dependence on deficit spending. That same deficit spending was a key driver behind Q1 2025’s 5.4% GDP growth—just as it has been in many previous quarters/years. 

Also, it is crucial to distinguish the nature of government spending and revenue: while expenditures are programmed or mandated by Congress, actual disbursements are increasingly prone to executive discretion, with breaches of the enacted budget observed over the past six straight years—symptoms of centralization of power. 

In contrast, revenues depend on both economic activity and administrative collection efforts. 

Despite a 13.6% year-on-year increase in tax revenues in Q1, this gain failed to offset the collapse in non-tax revenues, which plunged by 41.2%. This drop severely weakened the overall revenue base. 

X. Non-Tax Revenues: A High Base Hangover; Rising Risk of a Consecutive Deficit Blowout

Non-tax revenues surged by 57% in 2024, lifting their share of total collections to 13.99%—the highest since 2007’s 17.9%.  (Figure 7, second to the highest chart) 

With a long-term average of 11.7% since 2000, current levels are markedly elevated. Moreover, 2024 figures significantly exceeded the exponential trend, indicating the potential for a substantial retracement. 

While the official breakdown or targets for collection categories remain undisclosed, it is plausible that non-tax revenue targets for 2025 were benchmarked against last year’s elevated base—potentially complicating fiscal planning and exacerbating volatility in public revenue performance 

Authorities expect total revenues to reach 16.5% of GDP in 2025. Yet, in Q1, the revenue-to-GDP ratio slipped to 15.15%, reflecting the substantial shortfall in non-tax collections. 

This implies that the Bureau of Internal Revenue (BIR) and Bureau of Customs (BOC)—which posted 16.7% and 5.7% year-on-year growth respectively in Q1—would need to significantly accelerate collections to bridge the gap. 

But the Q1 data suggests that current tax growth trends are unlikely to be sufficient. 

If tax revenue growth merely holds steady—or worse, underperform—then Q1’s historic deficit may not be a one-off.  

Instead, it risks being carried into Q2, leading to a second consecutive quarter of elevated deficits.  

This would reinforce perceptions of fiscal slippage or ‘entropy’, with direct implications for financial markets, interest rates, and banking sector dynamics.  

XI. April 2025 Data as a Critical Clue of Fiscal Health  

The Bureau of the Treasury is expected to release the April 2025 National Government Cash Operations Report (COR) in the final week of May.  

Due to the shift in VAT filing from monthly to quarterly, April’s figures will be the first major test of whether tax receipts can rebound sharply enough to counterbalance the Q1 shortfall.  

April is typically one of the stronger months for collections. For instance, in January 2024, the government recorded a Php 87.95 billion surplus—the highest since 2023—following changes in the VAT reporting regime. (Figure 7, second to the lowest graph) 

To keep the 2025 full-year deficit ceiling of Php 1.54 trillion within reach, the government would need to secure multiple monthly surpluses—or at least significantly smaller deficits

A hypothetical Php 200 billion surplus in April would be required to partially offset Q1’s Php 478 billion fiscal gap and keep the official trajectory on track.  

XII. Aside from Deficit Spending, Escalating Risk Pressures from Trade Disruptions and Domestic Economic Slack  

However, this fiscal balancing act is made more difficult by worsening external and domestic conditions.  

The global trade slowdown—exacerbated by ongoing trade tensions and supply chain fragmentation—will likely weigh on the Philippines’ external trade. 

Meanwhile, intensifying signs of slack in the domestic economy further threaten revenue generation, especially for the BIR and BOC. 

These pressures highlight the structural reliance on debt-financed deficit spending

Rising fiscal shortfalls increase sovereign risk, which can ultimately be transmitted into the broader economy through multiple channels—elevated inflation or stagflation risks, weakening credit quality or credit risks, liquidity pressures in the banking system and more. 

Contagion risks may also emerge in financial markets, manifesting through a surge in the USD/Php exchange rate (currency risk), rising bond yields (currently diverging from declining ASEAN counterparts) or interest rate risk, and amplified volatility in the stock market (including related markets—market risk). (Figure 7, lowest image) 

All these factors align with—and reinforce—the deteriorating liquidity and funding conditions apparent in bank balance sheets.

The nexus between fiscal fragility and banking stress is no longer theoretical; their growing interdependence is symptomatic in slowing deposit growth, increased reliance on repo markets, and rising bank borrowing. 

XIII. Final Thought: Deepening Fiscal-Bank Interdependence Expands Contagion Risk Channels 

As fiscal risks mount, so too does the potential for cross-sectoral contagion and cascading effects. The banking system—already struggling with liquidity depletion—faces heightened exposure due to its expanding claims on sovereign securities (implicit quantitative easing). 

Again, though partially obscured, stagflationary pressures, deteriorating credit quality, and rising funding costs may converge, amplifying broader macro-financial instability. 

In short, the fiscal storm is no longer a distant threat—it is approaching fast, and its first casualties may already be visible in the cracks forming across the financial system. 

______   

Reference 

Prudent Investor, BSP’s Fourth Rate Cut: Who Benefits, and at What Cost?, April 13,2025, Substack

Sunday, March 16, 2025

The BSP’s One-Two Punch: Can RRR Cuts and PDIC Deposit Insurance Avert a Liquidity Crisis?


Historical research on bank runs indicates that the reason people run is run is not fear of people running. People typically ran when the bank was already insolvent. Healthy purpose of closing the bank before the bank lost even more money. True, the losses were unevenly distributed, depending on whether you got on the front of the line or the back of the line. In a way, that provides a useful incentive mechanism: monitor your bank and don't rely on other people to monitor it for you—Lawrence White

In this issue

The BSP’s One-Two Punch: Can RRR Cuts and PDIC Deposit Insurance Avert a Liquidity Crisis?

I. From Full Reserves to Fractional Banking: The Risks of a Zero-Bound RRR

II. Has the BSP’s "Easing Cycle"—Particularly the RRR Cut—Eased Liquidity Strains?

III. Bank Assets: A Tale of Contradictions: Booming Loans and Liquidity Pressures

IV. Bank Credit Boom Amid Contradictions: Soaring Credit Card NPLs as Real Estate NPLs Ease

V. Investments: A Key Source of Liquidity Pressures

VI. Hidden Risks in Held-to-Maturity (HTM) Securities: Government Debt

VII. Slowing Deposit Growth and the Structural Changes in the Banking System’s Asset Distribution

VIII. Liquidity Constraints Fuels Bank Borrowing Frenzy

IX. PDIC’s Doubled Deposit Insurance: A Confidence Tool or a Risk Mitigant?

X. Conclusion: Band-aid Solutions Magnify Risks

The BSP’s One-Two Punch: Can RRR Cuts and PDIC Deposit Insurance Avert a Liquidity Crisis?

Facing the risks from lower bank reserve requirements, the BSP may have pulled a confidence trick by doubling deposit insurance. But will it be enough to avert the ongoing liquidity stress?

I. From Full Reserves to Fractional Banking: The Risks of a Zero-Bound RRR 

Full reserve banking originated during the gold standard era, where banks acted as custodians of gold deposits and issued paper receipts fully backed by gold reserves. This system ensured financial stability by preventing the expansion of money beyond available reserves. However, as banks realized that depositors rarely withdrew all their funds simultaneously, they began lending out a portion of deposits, leading to the emergence of fractional reserve banking.

Over time, governments institutionalized this practice, largely due to its political convenience—enabling the financing of wars, welfare programs, and other government expenditures. This shift was epitomized by 1896 Democratic presidential candidate William Jennings Bryan's famous speech in which he declared, "You shall not crucify mankind upon a cross of gold!" 

Governments reinforced this transition through the creation of central banks and an expanding framework of regulations, including deposit insurance. Ultimately, these policies culminated in the abandonment of the gold standard, most notably with the Nixon Shock of August 1971

While fractional reserve banking has facilitated economic growth by expanding credit, it has also introduced significant risks. These include bank runs and liquidity crises, as seen during the Great Depression, the 2008 financial crisis, and the 2023 U.S. banking crisis; inflationary pressures from excessive credit creation; and moral hazard, where banks engage in riskier practices knowing they may be bailed out. 

The system’s reliance on high leverage further contributes to financial fragility. 

The risks of fractional reserve banking are amplified when the statutory reserve requirement (RRR) approaches zero. A zero-bound RRR effectively removes regulatory constraints on the proportion of deposits banks can lend, increasing liquidity risk if sudden withdrawals exceed available reserves. 

This heightens the probability of bank runs, making institutions more dependent on central bank intervention for stability. 

Additionally, a near-zero RRR expands the money multiplier effect, increasing the risks of excessive credit creation, exacerbating asset-liability mismatches, fueling asset bubbles, and intensifying inflationary pressures—ultimately turning individual failures into systemic vulnerabilities that repeatedly require central bank intervention. 

Without reserve requirements, banking stability relies entirely on the presumed effectiveness of capital adequacy regulations, liquidity buffers, and central bank oversight, increasing systemic dependence on monetary authoritiesfurther assuming they possess both full knowledge and predictive capabilities (or some combination thereof) necessary to contain or prevent disorderly outcomes arising from the buildup of unsustainable financial and economic imbalances (The knowledge problem). 

Moreover, increased reliance on these authorities leads to greater politicization of financial institutions, fostering inefficiencies such as corruption, regulatory capture, and the revolving door between policymakers and industry players—further distorting market incentives and deepening systemic fragility. 

Consequently, while a zero-bound RRR enhances short-term credit availability, it also raises long-term risks of financial instability and contagion during crises

At its core, zero-bound RRR magnifies the inherent fragility of fractional reserve banking, increasing systemic risks and reliance on central bank intervention. By removing a key buffer against liquidity shocks, it transforms banking into a highly unstable system prone to crises. 

II. Has the BSP’s "Easing Cycle"—Particularly the RRR Cut—Eased Liquidity Strains?

Businessworld, March 15, 2025: THE PHILIPPINE BANKING industry’s total assets jumped by 9.3% year on year as of end-January, preliminary data from the Bangko Sentral ng Pilipinas (BSP) showed. Banks’ combined assets rose to P27.11 trillion as of end-January from P24.81 trillion in the same period a year ago. Month on month, total assets slid by 1.2% from P27.43 trillion as of end-December. 

In the second half (2H) of 2024, the Bangko Sentral ng Pilipinas (BSP) launched its "easing cycle," implementing three interest rate cuts and reducing the reserve requirement ratio (RRR) on October 25.

A second RRR reduction is scheduled for March 28, 2025, coinciding with the Philippine Deposit Insurance Corporation (PDIC) doubling its deposit insurance coverage, effective March 15.

Yet, despite these measures, the Philippine GDP growth slowed to 5.2% in 2H 2024—a puzzling decline amid record-high public spending, unprecedented employment rates, and historic consumer-led bank borrowing. 

Has the BSP’s easing cycle, particularly the RRR cuts, alleviated the liquidity strains plaguing the banking system? The evidence suggests otherwise. 

III. Bank Assets: A Tale of Contradictions: Booming Loans and Liquidity Pressures 

Philippine bank assets consist of cash, loans, investments, real and other properties acquired (ROPA), and other assets. In January 2025, cash, loans, and investments dominated, accounting for 9.8%, 54.2%, and 28.3% respectively—totaling 92.3% of assets.


Figure 1

Loan growth has been robust. The net total loan portfolio (including interbank loans IBLs and reverse repos RRPs) surged from a 10.7% year-on-year (YoY) increase in January 2024 to 13.7% in January 2025.

As a matter of fact, loans have consistently outpaced deposit growth since hitting a low in February 2022, with the loans-to-deposit ratio accelerating even before the BSP’s first rate cut in August 2024. (Figure 1, topmost graph)

Historical trends, however, reveal a nuanced picture.

Loan growth decelerated when the BSP hiked rates in 2018 and continued to slow even after the BSP started cutting rates. Weak loan demand at the time overshadowed the liquidity boost from RRR cuts. (Figure 1, middle image)

Despite the BSP reducing the RRR from 19% in March 2018 to 12% in April 2020—coinciding with the onset of the pandemic—loan growth remained weak relative to deposit expansion. 

It wasn’t until the BSP's unprecedented bank bailout package—including RRR cuts, a historic Php 2.3 trillion liquidity injection, record-low interest rates, USD/PHP cap, and various bank subsidies and relief programs—that bank lending conditions changed dramatically. 

Loan growth surged even amid rising rates, underscoring the impact of these interventions. 

Last year’s combination of RRR and interest rate cuts deepened the easy money environment, accelerating credit expansion. 

The question remains: why? 

IV. Bank Credit Boom Amid Contradictions: Soaring Credit Card NPLs as Real Estate NPLs Ease 

Authorities claim credit delinquencies remain "low and manageable" despite a January 2025 uptick. Since peaking in Q2 2021, gross and net NPLs, along with distressed assets, have declined from their highs. (Figure 1, lowest chart)

Figure 2

This stability is striking given record-high consumer credit—the banking system’s fastest-growing segment—occurring alongside slowing consumer spending.  (Figure 2, topmost window)

While credit card non-performing loans (NPLs) have surged, their relatively small weight in the system has muted their overall impact.

Real estate NPLs have paradoxically stabilized despite a deflationary spiral in property prices in Q3 2024.

Real estate GDP fell to just 3% in Q4—its lowest level since the pandemic recession—dragging its share of total GDP to an all-time low. (Figure 2, middle visual)

Record bank borrowings, a faltering GDP, and price deflation amidst stable NPLs—this represents 'benchmark-ism,' or 'putting lipstick on a statistical pig,' at its finest.

Ironically, surging loan growth and low NPLs should signal a banking industry awash in liquidity and profits.

Yet how much of unpublished NPLs have been contributing to the bank's liquidity pressures?

Still, more contradictory evidence.

V. Investments: A Key Source of Liquidity Pressures 

Bank investments, another major asset class, grew at a substantially slower pace, dropping from 10.7% YoY in December 2024 to 5.85% in January 2025.

This deceleration stemmed from a sharp slowdown in Available-for-Sale (AFS) assets (from 20.45% to 12% YoY) and Held-for-Trading (HFT) assets, which, despite a 22.17% YoY rise, slumped from December’s 117% spike. This suggests banks may have suffered losses from short-term speculative activities, potentially linked to the PSEi 30’s 11.8% YoY and 10.2% MoM plunge in January. (Figure 2, lowest chart)

Ironically, the Financial Index—comprising seven listed banks—rose 15.23% YoY and 0.72% MoM, indicating that losses in bank financial assets stemmed from non-financial equity holdings.

Figure 3

Despite easing interest rates, market losses on the banks’ fixed-income trading portfolios remained elevated, improving (33.5% YoY) only slightly from Php 42.4 billion in December to Php 38 billion in January. (Figure 3, topmost pane) 

VI. Hidden Risks in Held-to-Maturity (HTM) Securities: Government Debt 

Yet, HTM assets declined just 0.5% YoY. Given that 10-year PDS rates remain elevated, HTMs are likely to reach new record highs soon. (Figure 3, middle image)

Banks play a pivotal role in supporting the BSP’s liquidity injections by monetizing government securities. Their holdings of government debt (net claims on central government—NcoCG) reached an estimated 33% of total assets in January 2025—a record high.  (Figure 3, lowest graph)

Figure 4

Public debt hit a fresh record of Php 16.3 trillion last January 2025. (Figure 4, topmost diagram)

Valued at amortized cost, HTM securities mask unrealized losses, potentially straining liquidity. Overexposure to long-duration HTMs amplifies these risks, while rising government debt holdings heighten banks’ sensitivity to sovereign risk.

With NCoCG at a record high, this tells us that banks' HTMs are about to carve out another fresh milestone in the near future.

In short, losses from market placements and ballooning HTMs have offset the liquidity surge from a lending boom, undermining the BSP’s easing efforts.

VII. Slowing Deposit Growth and the Structural Changes in the Banking System’s Asset Distribution

Deposit growth should ideally mirror credit expansion, as newly issued money eventually finds its way into deposit accounts.

Sure, the informal economy remains a considerable segment. However, unless a huge amount of savings is stored in jars or piggy banks, it’s unlikely to keep a leash on the money multiplier.

The BSP’s Financial Inclusion data shows that more than half of the population has some form of debt outside the banking system. This tells us that credit delinquencies are substantially understated—even from the perspective of the informal economy

Yet, bank deposit liabilities grew from 7.05% YoY in December 2024 to 6.8% in January 2025, led by peso deposits (7% YoY), while FX deposits slowed from 7.14% to 6.14%. Peso deposits comprised 82.8% of total liabilities. (Figure 4, middle image)

Since 2018, deposit growth has been on a structural downtrend, with RRR cuts failing to reverse this trend. (Figure 4, lowest visual)

Figure 5

The gap between the total loan portfolio (excluding RRPs and IBLs) and savings widened, with TLP growth rising from 12.7% to 13.54% YoY, while savings growth doubled from 3.3% to 6.8%. (Figure 5, topmost graph)

How did these affect the bank’s cash reserves?

Despite the October 2024 RRR cut, cash reserves contracted 1.44% YoY in January 2025. In peso terms, cash levels rebounded slightly from an October 2024 interim low—mirroring 2019 troughs—but this bounce appears to be stalling. (Figure 5, middle chart)

The ongoing liquidity drain has effectively erased the BSP’s historic cash injections.

The bank's cash and due-to-bank deposits ratio has hardly bounced despite the RRR cuts from 2018 to the present! (Figure 5, lowest pane)

Figure 6

Liquidity constraints are further evident in the declining liquid-to-deposit assets ratio. (Figure 6, topmost pane)

In perspective, the structural changes in operations have led to a pivotal shift in the distribution of the bank's assets. (Figure 6, middle graph)

Cash’s share of bank assets has shrunk from 23.1% in October 2013 to 9.8% in January 2025.

While the share of loans grew from 45.3% in November 2010 to a peak of 58.98% in May, it dropped to a low of 51.6% in March 2024 before partially recovering.

Meanwhile, investments, rebounding from a 21.42% trough in June 2020, have plateaued since the BSP’s 2022 rescue package.

Still, the Philippine banking system continues to amass significant economic and political clout, effectively monopolizing the industry, as its share of total financial resources reached 83.64% in 2024. How does this mounting concentration risk translate to stability? (Figure 6, lowest chart)

VIII. Liquidity Constraints Fuels Bank Borrowing Frenzy 

In addition to the 'easy money' effect of fractional banking's money multiplier, banks still require financing for their lending operations.


Figure 7

Evidence of growing liquidity constraints, exacerbated by insufficient deposit growth, is seen in banks' aggressive borrowing from capital markets. 

Bank borrowing, comprising bills and bonds payable, reached a new record of PHP 1.78 trillion in January, marking a 47.02% year-over-year increase and a 6.5% month-over-month rise! (Figure 7, topmost diagram) 

Notably, bills payable experienced a 67% growth surge, while bonds payable increased by 17.5%.  The strong performance of bank borrowing has resulted in an increase in their share of overall bank liabilities, with bills payable now accounting for 5.1% and bonds payable for 2.43% in January. (Figure 7, middle pane) 

In essence, banks are competing fiercely among themselves, with non-bank clients, and the government to secure funding from the public's strained savings. 

Moreover, although general reverse repo usage has decreased, largely due to BSP actions, interbank reverse repos have surged to their second-highest level since September 2024. (Figure 7, lowest chart) 

The increasing scale of bank borrowings, supported by BSP liquidity data, reinforces our view that banks are struggling to maintain system stability. 

IX. PDIC’s Doubled Deposit Insurance: A Confidence Tool or a Risk Mitigant? 

The doubling of the Philippine Deposit Insurance Corporation's (PDIC) deposit insurance coverage took effect on March 15th

The public is largely unaware that this measure is linked to the second phase of the reserve requirement ratio (RRR) cut scheduled for March 28th

In essence, the Bangko Sentral ng Pilipinas (BSP), through its attached agency the PDIC, is utilizing the enhanced deposit insurance as a confidence-building measure to reinforce stability within the banking system. 

Inquirer.net, March 15, 2025: The Philippine Deposit Insurance Corp. (PDIC)—which is mandated to safeguard money kept in bank accounts —finally implemented the new maximum deposit insurance coverage (MDIC) of P1 million per depositor per bank, which was double the previous coverage of P500,000. The expanded MDIC is projected to fully insure over 147 million accounts in 2025, or 98.6 percent of the total deposit accounts in the local banking system. In terms of amount, depositor funds amounting to P5.3 trillion will be safeguarded by the PDIC, accounting for 24.1 percent of the total deposits held by the banking sector. To compare, the ratio of insured accounts under the old MDIC was at 97.6 percent as of December 2024. In terms of amount, the share of insured funds to total deposits was at 18.4 percent before. It was the amendments to the PDIC charter back in 2022 that allowed the state insurer to adjust the MDIC based on inflation and other relevant economic indicators without the need for a new law. (bold added)

ABS-CBN News, March 14: PDIC President Roberto Tan also assured the public that PDIC has enough funds to cover all depositors even with a higher MDIC. The Deposit Insurance Fund (DIF) is around P237 billion as of December 2024. The ration of DIF to the estimated insured deposits (EID) is 5% this 2025, which Tan said remains adequate to meet potential insurance risks. (bold added) 

Our Key Takeaways: 

1) An Increase in Compensation rather than Coverage Ratio, Yet Systemic Coverage Remains Low

-The total insured deposit amount is capped at PHP 1 million per depositor.

98.6% of accounts are fully insured, up from 97.6% previously.

-The insured deposit amount increased to PHP 5.3 trillion (24.1% of total deposits) from PHP 3.56 trillion (18.4%) prior to the MDIC.

2) Systemic Risk and Vulnerabilities

-Most of the increase in insured deposits stems from small accounts.

-Large corporate and high-net-worth individual deposits remain largely uninsured, maintaining systemic vulnerability.

3) PDIC’s Coverage Limitations

-The PDIC only covers BSP-ordered closures, excluding losses due to fraud.

-If bank failures are triggered by fraud (e.g., misreported loan books, hidden losses), depositor panic may escalate before the PDIC intervenes.

-Runs on solvent banks could still occur if system trust weakens.

Figure/Table 8 

4) Mathematical Constraints on PDIC's Deposit Insurance Fund (DIF) and Assets

-The PDIC's 2023 total assets of PHP 339.6 billion account for only 1.74% of total deposits. (Figure/Table 8)

-The Deposit Insurance Fund (DIF) of PHP 237 billion represents a mere 6.7% of insured deposits.

-PDIC assets and DIF account for 3.46% and 2.42% of the deposit base of the four PSEi 30 banks.

-In the event of a mid-to-large bank failure, the DIF would be insufficient, necessitating government or BSP intervention.

5) The Systemic Policy Blind Spot

-Such policy assumes an "orderly" distribution of bank failures—small banks failing, not large ones. In reality, tail risks (big bank failures) drive financial crises, not small-bank failures.

6) Impact of RRR Cuts on Risk-Taking Behavior

-The second leg of the RRR cut in March 2025 injects liquidity, potentially encouraging higher risk-taking by banks.

-Once again, the increase in deposit insurance likely serves as a confidence tool rather than a genuine risk mitigant.

7) Rising risk due to moral hazard: The increased insurance may encourage riskier behavior by both depositors and banks.

8) Consequences of Significant Bank Failures

-If funds are insufficient, the Bureau of Treasury might cover the DIF gap. Such a bailout would expand the fiscal deficit, with the BSP likely to monetize debt.

-A more likely scenario is that the BSP intervenes directly, as the PDIC is an agency of the BSP, by rescuing depositors through liquidity injections or monetary expansion.

In both scenarios, this would amplify inflation risks and the devaluation of the Philippine peso, likely exacerbated by increased capital flight and a higher risk premium on peso assets. 

X. Conclusion: Band-aid Solutions Magnify Risks 

The BSP’s easing cycle has fueled a lending boom, masked NPL risks, and propped up government debt holdings, yet liquidity remains elusive. Cash reserves are shrinking, deposit growth is faltering, and banks are borrowing heavily to stay afloat. 

The PDIC’s insurance hike offers little systemic protection, leaving the banking system vulnerable to tail risks. A mid-to-large bank failure would likely burden the government or BSP, triggering further unintended consequences. 

As contradictions mount, a critical question persists: can this stealth loose financial environment sustain itself, or is it a prelude to a deeper crisis?