The reason why I think that too deliberate striving for immediate usefulness is so likely to corrupt the intellectual integrity of the economist is that immediate usefulness depends almost entirely on influence, and influence is gained most easily by concessions to popular prejudice and adherence to existing political groups. I seriously believe that any such striving for popularity – at least til you have very definitely settled your own convictions, is fatal to the economist and that above anything he must have the courage to be unpopular- Friedrich August von Hayek
Global financial markets performed as expected[1] this week characterized by sharp volatility in both directions with a downside bias.
The Risk OFF mode appears to be spreading from emerging markets and now to the developed market contemporaries. Except for the Philippines and Indonesia, most of the world bourses posted NEGATIVE returns for January.
Negative returns in January have not been a good portent for stock market returns for the year. The seasonality factors of the influx of yearend bonuses and annual asset allocation, known as the January Effect[2], particularly for the S&P 500 seem to have failed to weave their periodical wonders. As Jeffrey Hirsch of the Stock Market Almanac, who created the January Barometer via Yale Hirsch, noted last December[3] “as the S&P goes in January so goes the year”. The S&P’s history shows that the January effect has 89.1% accuracy. You can see the chart from moneyweek.com here.
I am not a fan of seasonality based forecasting. Despite the 89.1% accuracy, the S&P’s performance for 2014 can always result in favor of the outlier or the 10.9%. Different factors drive each year’s performance. For instance, late last year the mainstream worshippers of the Philippine bubble sold the seasonal ‘Santa Claus rally’ for the Phisix which I argued otherwise[4]. By the close of 2013, the statistical outlier proved the day: the Phisix posted a -9% return for November-December.
But I would have to share with the stock market almanac the likely probability of a negative return for the S&P 500 for 2014, for one simple reason: stock market bulls have frontloaded returns of the S&P which had been driven to record territory through record borrowings as exhibited by record net margin debt and by record accumulation of various bonds to finance a massive wave of stock market buyback. This comes in the face of the second series of the US Federal Reserve’s withdrawal of monetary accommodation this week, as Chairman Ben Bernanke exits in favor of his replacement incoming Janet Yellen[5].
The record breaking streak by US stocks has also been revealing of a shift in the composition of participants: the swelling of retail investors chasing returns as institutional investors reduce exposure. All these, for me, constitute the Wile E. Coyote momentum that eventually leads to the Wile E. Coyote moment (Wile Coyote surprisingly discovers that he has run far off from the cliff). The Wile E. Coyote moment can easily morph into an economic and or financial Black Swan[6].
So aside from massive internal imbalances, external factors in terms of the continuing riot in emerging markets have been compounding to the pressures of the S&P 500. The same dynamics should hold true for the financial markets of other developed economies that has benefited from the last hurrah of easy money policies of 2013.
Yet if financial markets in developed economies continue to remain under pressure (e.g. falling stocks) this will aggravate financial market conditions of emerging markets. Unless contained, the feedback loop between emerging markets-developed markets may lead to a precipitate acceleration of a downward spiral.
Has Emerging Market Woes been Bullish for the US stock markets?
One of the bizarre rationalisation used by the US stock market bulls has been to show how the US stock market benefited from the troubles of Emerging Markets during the 1990s which they posit as a likely repeat of history. The seemingly schadenfreude analysis suggests that revulsion on Emerging Market assets will likely will find a haven or rotate to US stocks.
I believe that such an argument represents a warped perception of reality for one simple reason; the failure to appreciate the material changes in the contribution of emerging markets to the global economy and financial markets.
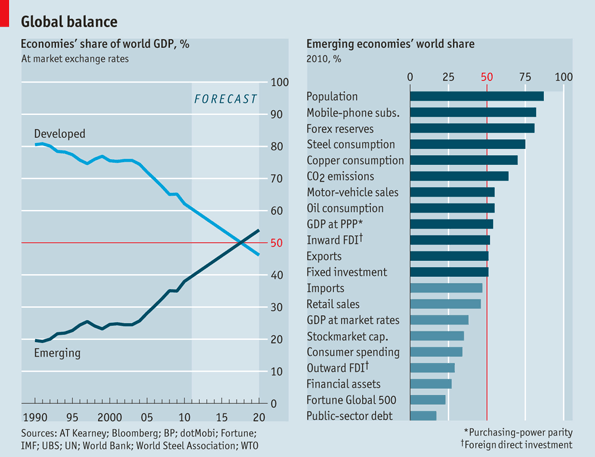
First of all emerging markets have grown faster than advanced economies such that emerging markets now account for 38% of the global GDP (2010). See chart here.
In addition, as share of global consumer spending, emerging markets have already supplanted the US. As of 2010, the US share has declined from a high of 35% in 2000 to a little above 25% whereas Emerging Markets have expanded from less than 25% in 2000 to just under 35%, see chart here.
More important has been the burgeoning share of financing via exploding bond issuance, record capital flows, and the recent ballooning of index-tracking Exchange Traded Funds (ETFs) which has served as a vehicle for record portfolio flows.
Record emerging market capital flows (top) and Record Emerging Market US Dollar Bond issuance (bottom)[7]
Some data on the growing significance of emerging market to the world in terms of finance to chew on, from Reuters[8] (bold mine):
Emerging markets have attracted about $7 trillion since 2005 through a mix of direct investment in manufacturing and services, mergers and acquisitions, and investment in stocks and bonds, the Institute for International Finance estimates.
JPMorgan estimates outstanding emerging market bonds at $10 trillion compared with just $422 billion in 1993. Assets of funds benchmarked to emerging debt indices stand at $603 billion, more than double 2007 levels, it said, and over $1.3 trillion now follows MSCI's main emerging equity index.
Mutual fund data from Lipper, a ThomsonReuters service, shows that in the past 10 years net inflows into debt and equity markets was in the region of $412 billion.
Significantly, there have been few major hiccups in emerging economies in that period, and only in the global crisis year of 2008 and in 2013 were there any net redemptions, Lipper showed.
The result, many say, is a recipe for fund redemptions snowballing when returns fall below a certain level.
Losses in one or two markets can leave managers with no choice but to liquidate other positions to protect the fund's net asset value (NAV), the main indicator of how profitable a fund is relative to its assets.
Others argue that despite the growing importance of the Emerging Markets, they remain of little threat to developed economies. The following charts are examples[9]
If we only see and read the statistical data of the small exposures of developed economies and the US to emerging markets and refrain from thinking beyond what could happen next, then sure, the impact will indeed be small.
But this hasn’t been the way the world works. Even when the exposure would seem negligible, if the adverse impact of emerging markets to the US and developed economies won’t be offset by growth (exports, bank assets and corporate profits) in developed nations or in frontier nations, then there will be a drag on the growth of developed economies, which would hardly be inconsequential. Why? Because the feedback loop from the sizeable developed economies will magnify on the downside trajectory of emerging market growth which again will ricochet back to developed economies and so forth. Such feedback mechanism is the essence of periphery-to-core dynamics which shows how economic and financial pathologies, like biological contemporaries, operate at the margins or by stages.
And as noted above, the problem hasn’t just been about emerging markets but also about immensely mispriced assets, powered by massive accumulation of debt, promoted by devotees of inflationism, that seem to have come under pressure from the side effects of prolonged easy money conditions and accentuated by the reduction of free lunch policies that has worked in favor of Wall Street at the expense of main street since 2008.
How will these not have an effect on the S&P 500 when the % share of foreign sales of S&P companies has ballooned to almost half of the total[10]? In 2003 foreign sales comprised 41.84% relative to 2012 where foreign sales grew to 46.59%. Think of how much smaller foreign sales had been during the 90s.
So while emerging markets sales does not entirely represent foreign sales, yet if the turmoil in Emerging Markets intensifies, then such a drag will gnaw on the growth conditions of the rest of the world that will be reflected equally on the foreign sales of the S&P 500 companies and to stock market prices.
So arguing 1990s as parallel today is a good example of mistaking the forest from trees.
Others further argue that the miseries of EM will be discriminatory or selective.
Perhaps in the future. But hardly a dynamic seen from the present. The following clue from Prudent Bear’s Doug Noland[11].
For the week versus the dollar, the Hungarian forint declined 3.7%, the Polish zloty 2.7%, the Russian ruble 1.7%, the Czech koruna 1.6%, the Bulgarian lev 1.4%, the Colombian peso 1.1%, the Chilean peso 0.9% and the Brazilian real 0.6%. The yen was little changed this week against the dollar, notably holding last week’s strong advance. Over two weeks versus the yen, the Argentine peso has declined 17.1%, the Russian ruble 6.6%, the Hungarian forint 6.1%, the Chilean peso 5.1%, the Brazilian real 5.0%, the Colombian peso 4.7%, the Polish zloty 4.6%, the South African rand 4.4%, the South Korean won 4.1% and the Indian rupee 3.9%.
Notable yield increases this week included Ukraine 10-year (dollar) yields jumping 55 bps to 9.85%. Russian yields rose 26 bps to 8.35%, Poland yields surged 30 bps to 4.70%, Hungary yields rose 36 bps to 6.0%, and South African yields rose 36 bps to 8.90%. As for equities, India’s Sensex index dropped 2.9%. Stocks in Taiwan were down 1.8%, Thailand 3.1%, Philippines 2.0%, Turkey 4.0%, Russia 3.4% and Chile 4.4%,
Discriminatory? Selective? Or the reverse of the rising tide lifts all boats?
If emerging markets has been attributed by some as having pulled out the global economy from the recession of 2008[12], now will likely be the opposite dynamic, the ongoing mayhem in emerging markets are likely to weigh on the global economy and equally expose on the illusions of strength brought upon by credit inflation stoked by inflationist policies.
As one would observe, most people have been programmed to shut down on facts which runs against their personal biases. This is what I call as the Aldous Huxley “Facts do not cease to exist because they are ignored” syndrome.
1997 Asian Crisis was a DEBT Crisis
The Aldous Huxley syndrome can also be seen in the local setting. The top honcho for one of the largest life insurance reportedly predicted a modest 10% gain for the Phisix[13].
I have no quibble in the cited figure which is a guess. This may or may not come true.
However I have to address the blatant inaccuracies from the claim the Philippines may withstand the hiccup in emerging markets due to floating exchange rate, vast foreign reserves and so-called sound footing of the banking system because banks then were crippled by high interest rates and by elevated non-performing loans.
First of all the 1997 Asian Crisis was about a DEBT crisis.
From Wikipedia.org[14], (bold mine)
Many economists believe that the Asian crisis was created not by market psychology or technology, but by policies that distorted incentives within the lender–borrower relationship. The resulting large quantities of credit that became available generated a highly leveraged economic climate, and pushed up asset prices to an unsustainable level. These asset prices eventually began to collapse, causing individuals and companies to default on debt obligations.
Fixed exchange rate only served to enhance the buildup of bubble conditions that had already been in place. As I pointed out in the past, when Japan’s bubble popped in 1990, much of Japan’s yield chasing money found their way to ASEAN[15] which partly help inflate the credit bubble. I would posit that even if the Philippines had a floating currency exchange then the bubble will have emerged anyway.
Of course, the Philippines was the least hit among ASEAN peers in the Asian Crisis. This is not because any special policies but because of the relatively less credit problems due to the low penetration level of households in the banking sector which is still true today.
Moreover, the claim that banks had been crippled by high interest rates and high Non performing loans (NPL) as a basis to say that Philippines banks are “sound” today signify as comparing apples to oranges.
After a credit bubble in the 1981-82[16], the Philippine government called for a debt moratorium in October 1983 but then resisted reforms prescribed by the IMF until a year after[17]. The debt moratorium can be seen by the spike in lending rates which more than doubled by 1983 (right window). The agreement on the IMF program by the Philippine government in 1984 may have led to a reversion of lending rates.
Political instability and concerns over debt conditions re-emerged to send lending rates skyrocketing again by 1987. The advent of the Aquino government led to a series of agreements (e.g. Paris Club) with IMF and various creditors, which hardly had been smooth sailing, for access to new money and for debt reduction measures over the following years.
It was perhaps only after the execution of the Brady Plan[18]—where the government used funds borrowed from IMF, World Bank and from other sources to purchase debt from the banks at half the price or at 50% discount, a rescheduling of debt due between 1990 and 1994, and the subscription of banks to US $700 million of new loans—when lending rates began its descent.
So the so-called Asian Economic Miracle or otherwise known as the “Four Asian Tigers”[19] or the new paradigm during heydays of inflationary boom thrived on low interest rates. And that high interest rates and a spike in NPLs came about as the boom metastasized into a bust in 1998 (left window)
As you can see, the comparison between a milieu of high interest rates and high Non performing loans (crisis scenario, during the aftermath of 1997) with low interest rates today (non-crisis scenario yet) has been arrantly misguided.
And it would be a serious mistake to project low NPLs tomorrow because of the low NPLs today. Such are examples of bubble logic. Perpetual low NPLs assume that unlimited debt growth will hardly have any real repercussions.
As for NPLs, at best, they are coincident indicators. Normally they are lagging indicators.
As I previously wrote[20],
NPLs are low because the current boom continues. NPLs become reliable indicators, when asset quality deteriorates or when the credit boom is in the process of reversing itself into a bust. Again they are coincident if not lagging indicators.
The Risks in Philippine Corporate Bonds
Developments in the bond markets are hardly a sign of “sound” finance. We can see part of this via the domestic corporate bond markets
According to the recent data from Deutsche Bank[21], the size of the Philippine corporate bond market in 2013 signified a measly 9.3% of the economy where 47.5% of corporate bonds outstanding are denominated in foreign currencies. Of the total bonds issued between 2009 and 2013, 34.1% have been in foreign currencies where floating rates signified 3.5% of the total issued. Meanwhile in terms of corporate leverage Philippine corporate bonds have a debt to equity ratio of 96.3 second only to China’s 104.6 as of 2012
The small size of bond markets fit exactly with the low penetration level of households in the banking and financial system. This means that the dearth of savings being intermediated into investments via the banking sector or via the capital markets have hardly been signs of real growth.
Importantly, because of the small size of the corporate bond market, the top 10 share in terms of % to the total is at 90.8%. Said differently, the benefits and risks of Philippine corporate bonds have been concentrated to these top 10 issuers.
The good news is that only a small portion or 3.5% of outstanding bonds issued have been floating rates. The bad news is that almost half of Philippine corporate bonds have been priced in foreign currencies. The depreciating peso means that more peso will be required to service every foreign currency unit of debt. A sustained fall of the peso will hurt the debt issuers. Worse, Deutsche Bank’s debt equity ratio for Philippine corporates at 96.3 reveals how leveraged those concentrated issuers have been.
Of the 30 top issuers 25 are publicly listed companies. The top 10 issuers have mostly been the blue chips, via ADB’s Asian Bond Monitor as of November 2013 namely[22] according to size of local currency bonds: San Miguel Brewery Inc, Ayala Land Inc., Ayala Corporation, BDO Unibank Inc., SM Investments Corporation, Philippine Long Distance Telephone Co, Philippine National Bank, Globe Telecom Inc, Maynilad Water Services and Energy Development Corporation
Also based on the same ADB data, banks and financial services have been the top issuers, followed by holding companies and real estate. Practically the same sectors contributing to the statistical economic boom.
As one would note Philippine financial system can be characterized as small but whose high debt exposures have been concentrated to a few.
As a popular saw goes, it ain’t over until the fat lady sings. And the fat lady has begun her concert rehearsals as seen in different Emerging Markets.
So NPLs will become an issue of concern when the credit conditions of these companies will be tested in the face of surging interest rates.
The best hope for the bulls is hardly about the Philippines becoming immune via “well positioned” claptrap but for the current EM storm to be just as another “hiccup”
The Great Divide: Statistical Boom Versus Deteriorating Public Sentiment
Speaking of statistical economic boom, the Philippines posted 7.2% economic growth for 2013. This has been exalted by bubble faithful as continued signs of progress. The timing of the release of the news came amidst a sharp decline in local stocks last Friday. Curiously some local investors, who appear to be price insensitive, drove up select Phisix issues as if the current conditions had been in a state of a mania. By the session’s end, the Phisix shaved off 1% from the intraday depth. The Phisix ended the day with a remarkably heavy volume at Php 8.9 billion even as foreigners sold heavily.
Have the majority owners been driving up their stocks for the Chinese New Year’s day celebrations, for month end adjustment or for other non-profit reasons? Or has Friday’s actions been conducted by some price insensitive third party agents using other people’s money with the desire to paint a positive aura backed by the release of the statistical growth figures?
I find the economic growth data release curious because the BSP usually publishes banking loan data ahead of the National government’s economic growth data.
Yet the statistical “new paradigm” boom practically showed the same sectors whom have been absorbing a lot of debt, in particular construction, financial intermediation and real estate.
And another curious item has been the significant growth in obscure areas of the durable equipment data in the capital formation category, in particular “Other general industrial mach” and “Other misc. durable equipment”. Yet these figures have been acquired via surveys which the NSCB notes, “the estimates are affected by the limitations of these surveys.”
Regardless of the ambiguous figures backing the statistical growth, here are my other more important observations on this[23]
I have noted that such statistical growth figures reveals no more than having been pumped up by credit. The 2013 growth data also divulges that statistical growth has largely been from entities with access to the banking and financial system. And given the limited banking access, statistical growth represents growth in the formal economy and hardly the informal economy. This means statistical growth has been hardly representative of the real economic conditions. The 2013 economic data continues to show how supply side has been growing faster than the demand side. Evidently the latter is unsustainable and will be exposed when fat lady sings.
I am not a fan of surveys but given the barrage of optimistic surveys by the so-called top rated businessmen and CEOs or the like, I noticed that survey reports concerning the general populace appear to have been sidelined by those especially from the financial industry.
Interestingly two recent surveys from two different companies tells of the same story
First the survey from SWS. From the Inquirer[24].
An estimated 11.8 million Filipino families rated themselves as poor, while some 8.8 million families said they were “food-poor,” a recent survey by Social Weather Stations (SWS) found.
The survey was conducted from Dec. 11 to 16 nationwide and the results were first published in the BusinessWorld newspaper.
SWS found 55 percent of the respondents saying that they were poor, up from 50 percent, or 10.8 million families, three months earlier.
It also found that 41 percent of the households considered themselves food-poor, up from 37 percent, or 7.9 million, in September. The poverty threshold is the monthly budget that households need in order not to consider themselves poor.
55% of people saying they are poor from 50% a quarter ago means an increase of 10% of people who think themselves as poor. The same sense of proportionality can be seen from those who consider themselves as “food poor” which is from 37 to 41%.
The boom has been making more people think about becoming poorer? How can that be? The fans of asset bubbles will likely retort with a snark, “they’re just being irrational!”
Another more eye opening survey from Pulse Asia, again from the Inquirer[25]
Despite the country’s high economic growth, most Filipinos considered their quality of life, both at the national and personal levels, to have worsened in the previous 12 months, results of a Pulse Asia survey last December showed.
They also expected the situation to remain the same for the whole of 2014.
The majority of Filipinos (55 percent) said the national quality of life deteriorated in the past 12 months, while 36 percent said the national situation remained unchanged. Nine percent said it improved.
Pulse Asia interviewed 1,200 adults all over the country from Dec. 8 to 15. The survey has a margin of error of plus-or-minus 3 percentage points at the 95-percent confidence level.
The figures last month differed significantly from those recorded in March 2013, Pulse Asia said.
Back then, 48 percent of Filipinos saw no change in the national quality of life in the previous 12 months. Thirty percent said it deteriorated and 23 percent noted an improvement.
From March to December last year, the percentage of Filipinos who said that the national quality of life worsened in the previous 12 months increased across geographic areas—ranging from 14 percentage points to 33 points; and among socioeconomic groups—ranging from 14 points to 30 points.
The Pulse Asia report has even been gloomier. The proportion itself from the current survey reveals a disturbingly huge chasm: 9% improvement versus 55% deterioration. Wow!
Applying the relative changes on ‘Improvement’ in March 2013 at 23% and in December 2013 at 9%; we see an astonishing 61% drop in positive outlook! As for the relative changes in ‘deterioration’ in March at 30% and in December at 55%, that would extrapolate to a whopping 83% surge in negative sentiment!!
The survey cites Meralco and Typhoon Yolanda as factors driving sentiment, but how can Meralco be a national issue when the company covers the National Capital Region (NCR) and the region’s fringes for her franchise? I would opine that price inflation may be a bigger factor driving this radical change in sentiment.
Yet if there has been any truth to these surveys then this means that whatever the statistical growth hasn’t been shared by most of the population (in numbers, in geographic areas, in the distribution of socio economic groups).
Even when we account for ‘improvement’ criteria, for both March and December, the proportionality of growth 23% and 9% seem to reflect on the distribution of the formal sector. However, the 9% improvement in December means that even many in the formal sector feels polarized from the current boom.
Worse, the above are signs that the informal economy have been in sick bed for quite sometime.
And such also seems to validate my perspective of the skewedness or specifically the non-representativeness of statistical growth data relative to real economic conditions.
So while the government can talk about their robust statistical growth ad infinitum to ensure their access to the credit markets in order to finance their politically correct justified boondoggles, as well as, to redistribute resources from society to the small segment (politically connected elites) who benefits from the credit fuelled property and stock market bubble out of zero bound rates policies, the real economy may be pushing back.
If this sentiment persist to become a trend or even deepens, then in terms of politics we can expect the political divide to widen. Ala Thailand, this may even lead to a political crisis sometime ahead.
And applied to the economy, this means bad news coming soon to the supply side whom has been overexpanding and whose undertaking have been backed by intensive credit inflation. Reason for the coming bad news? The negative sentiment suggests that there will be likely less buyers for their projects or services or securities.
The much vaunted Filipino consumer may have already hit the proverbial wall.


