There is no escape from
debt. Paying for the government’s fictitious promises in paper money will
result in a constantly depreciating currency, thereby impoverishing those who
earn a wage or have savings. Inflation is the hidden tax, and it is very
convenient for governments because they always blame shops or businesses and
present themselves as the solution by printing even more currency. Governments
want more inflation to reduce the impact of the enormous debt and unfunded
liabilities in real terms. They know they can’t tax you more, so they will tax
you indirectly by destroying the purchasing power of the currency they issue—Daniel
Lacalle
In this issue
Has the Philippine
Government Won Its Battle Against Inflation? SWS Self-Poverty Survey Disagrees, Unveiling Its Hidden Messages
I. Unveiling the Likely
Hidden Messages Behind the Declaration of Victory Over Inflation
II. Treasury Curve was Spot
On about Inflation, Short-Term Treasury Yields Plunge! Will the BSP Cut by 50
bps?
III. Supply-Side
Disinflation? Despite Strong Credit Growth, Manufacturing Remains in the
Doldrums, as Reflected by PPI Deflation and Output Sluggishness
IV. Supply-Side
Disinflation? Lethargic Consumer Imports and July FDI Reflect Frail Capital
Goods Imports
V. Demand-Side
Disinflation? September CPI Plunged Despite Vigorous August Consumer Bank
Lending, Liquidity Growth Dived
VI. Disinflation with
Employment at Near Historic Highs Backed by a Credit Boom? Slower Deficit
Spending Puts Pressure on Liquidity Strains
VII. SWS’s Self-Rated Poverty Survey versus the Government’s CPI
Has the Philippine Government Won Its Battle Against Inflation? SWS Self-Poverty Survey Disagrees: Unveiling Its Hidden Messages
A Philippine media outlet proclaimed that the Philippine government won its battle against inflation, while a private survey contradicted this view. Who's right?
I. Unveiling the Likely Hidden Messages Behind the Declaration of Victory Over Inflation

Two interesting headlines that hallmark this week’s conflicting message on inflation.
Inquirer.net, October 7, 2024: The Philippines may now declare victory in its long and painful fight against inflation after price growth last month eased to a four-year low, helping create the perfect economic condition for gradual interest rate cuts…The BSP is now at a point where it has to undo its most forceful tightening actions in two decades, which had sent the benchmark rate to its highest level in 17 years to tame stubbornly high inflation. Cutting borrowing costs is necessary amid market predictions that the economy may grow below the government’s target for this year after consumption showed signs of weakening…Moving forward, Governor Eli Remolona Jr. said the central bank would take “baby steps” until the key rate falls to 4.5 percent by the end of 2025, suggesting that monetary authorities would unlikely resort to jumbo cuts that may stir up market fears that the economy is headed for a hard landing. (bold mine)
SWS.org.ph, October 9, 2024: The national Social Weather Survey of September 14-23, 2024, found 59% of Filipino families rating themselves as Mahirap or Poor, 13% rating themselves as Borderline (by placing themselves on a line dividing Poor and Not Poor), and 28% rating themselves as Hindi Mahirap or Not Poor. The September 2024 percentage of Self-Rated Poor families rose by 1 point from 58% in June 2024, following a significant 12-point rise from 46% in March 2024. This was the highest percentage of Self-Rated Poor families since June 2008. The estimated numbers of Self-Rated Poor families were 16.3 million in September 2024 and 16.0 million in June 2024. The percentage of respondent households rating themselves as poor was applied to the Philippine Statistics Authority medium-population projections for 2024 to arrive at the estimated numbers of Self-Rated Poor families… The September 2024 survey found the percentage of Borderline families at 13%, up by 1 point from the record low 12% in June 2024 following an 18-point decline from 30% in March 2024… As of September 2024, the percentage of Not Poor families was at 28%, 2 points below the record high 30% in June 2024. (bold mine)
First and foremost, what does "declare victory in its long and painful fight against inflation" mean? (Figure 1, upper tweet)
The Philippine CPI posted two straight months of DEFLATION (statistical price decreases) in September (-0.37%) and October (-0.19%) 2015; yet, the media and establishment experts barely made such a brazen pronouncement until now.
Yes, Q3 2024 statistical inflation of 3.2% has dropped to its 9-year support level, but this doesn’t mean that the inflation cycle has been broken.

Figure 2
In Q3 2015, the CPI slipped into deflation at -0.1%, which prompted banks to accelerate their net claims on central government (NCoCG) or indirect QE. Ironically, this germinated the current inflation cycle, which is now on its ninth-year. (Figure 2 upper image)
Despite its recent decline, given that the CPI has remained on an uptrend since 2015 and appears to have settled at the support levels, what assurances does the establishment hold that it won’t be subject to a third wave?
Second, the September CPI of 1.9% doesn’t translate to the evisceration of inflation; it only means that GENERAL prices have risen at REDUCED rates (or have dropped to within the BSP’s target), but they are still RISING!
In fact, BSP data tell us that even in the context of the understated inflation rate, over 99% of the purchasing power of the peso has been eroded since 1957! How is that for "declaring victory over inflation"? (Figure 2, lower chart)
On the other hand, while authorities and media bask in this pretentious statistical feat, a private sector survey tell us a different story: slower inflation has exposed the persistent and growing burden of a lower standard of living! (More on this below.) (Figure 1, lower tweet)
Third, "declaring victory over inflation" was NEVER a goal of the BSP’s monetary policy anchored on inflation targeting.
From the BSP: The primary objective of the BSP's monetary policy is “to promote price stability conducive to a balanced and sustainable growth of the economy” (Republic Act 7653). The adoption of inflation targeting framework of monetary policy in January 2002 is aimed at achieving this objective. Inflation targeting is focused mainly on achieving a low and stable inflation, supportive of the economy’s growth objective. This approach entails the announcement of an explicit inflation target that the BSP promises to achieve over a given time period. (bold mine)
There is no defined quantification or qualification of "low and stable inflation" because statistical inflation has always been a subjective measure, arbitrarily defined by the BSP.
That said, the goal of the politics behind inflation targeting has been to keep the inflation "genie" confined within the boundaries of the BSP’s proverbial "lamp."
That’s because inflation, as a hidden tax, benefits the government most.
However, the inflation genie has been set loose, or has gone beyond its bounds, marking the difference between the previous era and today.
In this way, the BSP can be conservatively said to have been "asleep at the wheel."
At worst, and unbeknownst to the public, the BSP’s policies have unleashed the inflation genie!
Or, although authorities continue to push the narrative of supply-side-driven inflation to shift the blame onto the private sector, the current inflation cycle signify an unintended consequence of their policies!
Yet, has anyone among the array of establishment experts, including those in government, been correct in predicting the incumbent inflation cycle?
Fourth, the CPI is just a statistic. While its intent is to approximate changes in general prices, it neither reveals the full accuracy nor explains the causes of those changes.
The fact is that inflation statistics are misleading.
My inflation rate and yours are different. This is because of dynamic individual spending habits and ever-changing preferences that vary not only over time but also differs across individuals.
Is it not the averaging a Netflix subscription and rice an exercise of apples-to-oranges comparison? If so, would this not be applied to the CPI?
Or, not only is the weighted averaging of goods and services across different groups of people a flawed metric, but people’s spending preferences are constantly changing!
How accurate is an inflation rate derived from averaging the spending patterns of billionaires with those of the bottom 30%?
Even on a personal level, my preferences are always changing. If I prefer sautéed prawns with bread this moment, adobo with rice later, and only sinigang for tomorrow, how could the inputs used to create these meals be accurately averaged? How would this apply to a population of 110 million people?
Furthermore, because the CPI is a politically sensitive statistic—created and calculated by politically sensitive institutions—it is prone not only to errors (in assumptions, inputs, etc.) but also to political biases.
For instance, changing the base year of the CPI can lead to different outcomes. If I’m not mistaken, using the now-defunct 2006 base would produce a much higher CPI today than the current 2018 base.
Since the CPI is used as a primary benchmark for the market’s pricing of interest rates, wouldn’t the government—as the biggest borrowers—have the incentive or motivation to suppress it to influence the cost of borrowing?
Fifth, what happened to journalism?
Isn’t journalism about "seeking truth and providing a fair and comprehensive account of events and issues"?
When media outlets use ambiguous qualifications like " declare victory against inflation" to describe the "perfect economic condition for gradual interest rate cuts" intended to support "consumption (which) showed signs of weakening," could this not signify cheerleading or an advocacy for a biased policy stance? For whose benefit?
Might this be seen as advancing the interests of vested groups, particularly the primary beneficiary, the government and the politically connected elites? How is this different from propaganda, misinformation, or disinformation?
Importantly, if an alleged news article makes an economic generalization, why would it lack narratives supported by economic logic?
Or, are low rates a GUARANTEE of an INCREASE in consumption? How so, and based on what theory and evidence?
Why cite partisan and non-sequitur explanations from "establishment experts" whose principal-agent problems have hardly been laid bare to the public?
Have media outlets distilled such insights or selected statements for print that only promote their biases? I’ve seen this happen (personally) before, which is why I refuse interviews.
Sixth, if media pronouncements reflect exuded marketplace confidence, could such article/s signify a manifestation of the magazine/headline cover indicator or express an extreme state of sentiment?
Or have the media’s declarations echoed the "overconfidence" stemming from recent euphoria over the price spikes in Philippine assets (stocks, bonds, and the peso)?
Seventh and lastly, could this be related to the upcoming elections?
Will declaring 'victory in its long and painful fight against inflation' be part of the campaign to promote the electoral chances of the administration’s national slate in the 2025 midterm elections?
Ultimately, the establishment's obsession has been to promote a regime of easy money, using the declaration of triumph over inflation as justification.
As the great Austrian economist Ludwig von Mises once explained
The popularity of inflation and credit expansion, the ultimate source of the repeated attempts to render people prosperous by credit expansion, and thus the cause of the cyclical fluctuations of business, manifests itself clearly in the customary terminology. The boom is called good business, prosperity, and upswing. Its unavoidable aftermath, the readjustment of conditions to the real data of the market, is called crisis, slump, bad business, depression. People rebel against the insight that the disturbing element is to be seen in the malinvestment and the overconsumption of the boom period and that such an artificially induced boom is doomed. They are looking for the philosophers' stone to make it last (Mises, 2019)
II. Treasury Curve was Spot On about Inflation, Short-Term Treasury Yields Plunge! Will the BSP Cut by 50 bps?
While the headline CPI plummeted from 3.3% in August to 1.9% in September—its lowest monthly rate since May 2020—excluding food and energy, the core CPI slipped to 2.4%, signifying 17 of 18 months of decline (one unchanged) since peaking at 8% in March 2023.
Before that, we showed how changes in the Philippine yield curve have accurately predicted the CPI slump.
despite the 4.4% CPI bump in July (and Q2 6.3% GDP), the Philippine treasury market continues to defy inflationary expectations by maintaining a deep inversion of the curve’s belly, which again signals slower inflation, upcoming BSP cuts, and increased financial and economic uncertainty. (Prudent Investor, August 2024)
…
Moreover, the curious take is that despite all the massive stimulus, the belly’s inversion in the Philippine treasury market has only deepened at the close of August.
This does not suggest a build-up of price pressures or a strong rebound in the private sector. On the other hand, rising short-term rates indicate intensifying liquidity issues.
In the end, while Marcos-nomics stimulus seems to have reaccelerated liquidity, a resurgence of inflation is likely to exacerbate "stagflationary" pressures and increase the likelihood of a bust in the Philippines’ credit bubble. (Prudent Investor, September 2024)
Volatility has crescendoed in the Philippine treasury curve.
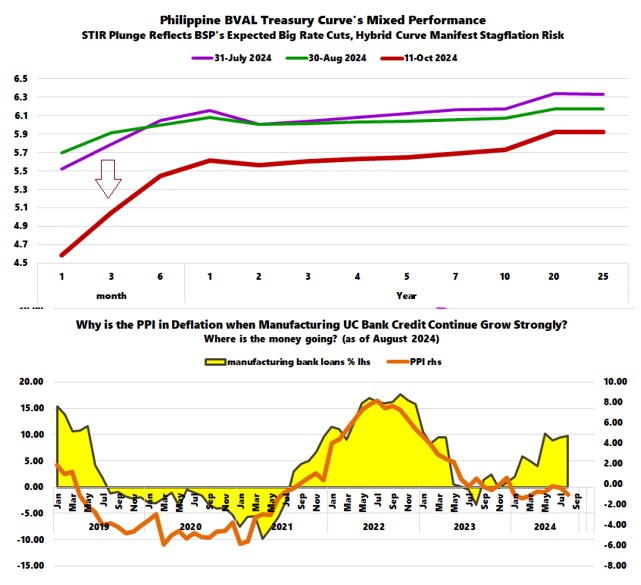
Figure 3
The present slope exhibits an astounding collapse in short-term rates (STIR), manifesting institutional market expectations of substantial cuts in BSP rates. Will the BSP cut by 50 bps this October? (Figure 3, upper graph)
Yet, the curve’s magnified volatility has been incredible: following the gradual transition from flat to an inverted curve, then swiftly to a bullish steepening, and next to the current abrupt regression to a partial belly inversion—even with the plunge in STIR—how could this not be conducive to the rising risks of stagflation?
III. Supply-Side Disinflation? Despite Strong Credit Growth, Manufacturing Remains in the Doldrums, as Reflected by PPI Deflation and Output Sluggishness
While we perceive government statistics with cynicism, we still use them because almost every financial market participant does.
Instead of focusing on the potential factors for the drop, the mainstream fixates on the prospective policy easing by the BSP.
Could the plunge in inflation have been a supply-side phenomenon marked by a glut?
In a word: Barely.
Manufacturing value grew by 2.9% in June, 6.45% in July, and 1.78% in August, while volume was up by 3.2%, 6.9%, and 2.8% over the same period.
Meanwhile, despite strong Universal Commercial Bank (UCB) loan growth to this sector—rising by 8.9%, 9.5%, and 9.8%—the Producer Price Index (PPI) deflated by -0.2%, -0.4%, and -1%. (Figure 3, lower chart)
Here’s the question: Why has robust credit growth not been reflected in output performance?
Worse yet, why is the deflation in the PPI escalating? PPI defined by the Philippine Statistics Authority, "measures the average change over time in the prices of products or commodities produced by domestic manufactures and sold at factory gate prices."
Where has all the credit money generated gone?
Has it been diverted to real estate or other undeclared allocations? Or has it been used for refinancing existing liabilities?
IV. Supply-Side Disinflation? Lethargic Consumer Imports and July FDI Reflect Frail Capital Goods Imports
If manufacturing growth has been unimpressive or sluggish, the situation is even worse for imports.
Imports in USD posted a 7.3% YoY contraction in June, then rose by 7.3% in July and 1.8% in August.
Converted to average pesos, imports were down by 2.63% YoY in June, surged by 14.3% in July, and grew by 4.6% in August, with the last month’s growth reflecting revaluation effects from a strong peso.

Figure 4
Here’s the thing: Consumer goods USD imports contracted by 7.3% in June, increased by 3.1% in July, and remained unchanged in August. (Figure 4, topmost pane)
Meanwhile, capital goods imports shrank by 8.8% in June but surged by 9.5% and 9.6% in the next two months. A substantial segment of the YoY changes reflects base effects. (Figure 4, middle diagram)
Nonetheless, the growth in capital goods imports partly reflected foreign direct investment (FDI).
The prosaic July FDI growth of 5.5% YoY (7.5% year-to-date) resonated with mediocre import growth. (Figure 4, lowest graph)
Yet, debt accounted for 74.3% of total FDI inflows and 63.5% of year-to-date FDI inflows. How much of this represent actual investments?
Still, why is the growth rate of FDIs declining?
Importantly, where are the investment pledges from the US-NATO allies?
V. Demand-Side Disinflation? September CPI Plunged Despite Vigorous August Consumer Bank Lending, Liquidity Growth Dived
Was the CPI slump a function of demand?
In short, yes!
We should put into context the seismic transformation of the Philippine banking system, with its recent focus on consumer loans coming at the expense of the supply side.

Universal Commercial (UC) bank consumer lending slowed from 24.3% year-over-year (YoY) in July to 23.7% in August, marking its slowest pace since November 2023. (Figure 5, topmost chart)
Consumer loan growth was strong across all segments in August: credit cards +27.44%, auto loans +19.3%, salary loans +16.4%, and others +26.8%.
Meanwhile, production loans continue to accelerate, expanding from 8.8% in July to 9.4% YoY in August, primarily in the real estate and trade sectors.
Overall, UC bank lending grew from 10.4% to 10.9% in August (Figure 4, second to the highest graph)
Despite mainstream claims of "restrictiveness" or "tightness" due to elevated rates, UC Bank's loan growth has been on an uptrend. Still, the CPI continues its downward trajectory!
Worse yet, despite this, financial liquidity plummeted in August.
M3 growth, which was 7.3% in July, dived to 5.5% in August. Incredible.
Incidentally, the yield curve inversion reflected this!
Once again, what happened to all the record money creation by the banking system and the BSP? Why the black hole?
VI. Disinflation with Employment at Near Historic Highs Backed by a Credit Boom? Slower Deficit Spending Puts Pressure on Liquidity Strains
Why could this be happening when employment rates are near all-time highs?
It was 96% last August, only a smidgen lower than the 96.9% record set last December 2023. (Figure 5, second to the lowest window)
Could it be that, aside from trade, government jobs were the primary source of growth in August? (Figure 5, lowest image)
Or could it also have been that employment growth has been mostly about low-quality labor? Alternatively, could the employment data also have been embellished?

Figure 6
Moreover, as we previously noted, because Philippine public spending has slowed, the fiscal deficit slightly "narrowed" year-to-date (YTD) as of August. Public spending has tracked the CPI over the long-term. (Figure 6, topmost diagram)
As a result, aided by the strong peso, public debt marginally weakened in August.
Moreover, has the stalling growth in system leverage (UC bank credit + public debt) contributed to the demand pressures reflected in the CPI? (Figure 6, second to the highest graph)
Consequently, net claims on the central government (NCoCG) by banks and the BSP plateaued or consolidated. (Figure 6, second to the lowest chart)
Or, aside from the BSP, liquidity injections channeled through banks have slowed slightly.
This, combined with a stealth rise in bank non-performing loans (NPLs) and elevated levels of held-to-maturity assets (HTMs), has contributed to the liquidity squeeze.
And this has occurred despite the record nominal bank credit expansion and historically high employment rates. The plunge in September’s CPI might reflect a downturn in public and private demand, possibly worsened by mounting signs of a liquidity shortfall.
VII. SWS’s Self-Rated Poverty Survey versus the Government’s CPI
Things don’t happen in a vacuum.
The BSP suddenly announced a massive reduction of the banking system’s reserve requirement ratio (RRR) on September 20th, obviously in response to such developments. The adjustment takes effect on October 25.
The PSA’s September CPI data exhibits a broad-based decline in price growth. While food prices had the biggest influence on the CPI’s significant downside volatility, slowing aggregate demand reflected the diminishing pace of price increases across most sectors. (Figure 6, lowest image)
All these factors point to the SWS Q3 data indicating an increase in self-rated poverty, which not only highlights the decline in living standards for a significant majority of families but also emphasizes the widening gap between the haves and the have-nots.
As a caveat, survey-based statistics are vulnerable to errors and biases; the SWS is no exception.
Though the proclivity to massage data for political goals is higher for the government, we can’t discount its influence on private sector pollsters either.
In any case, we suspect that a phone call from the office of the political higher-ups may compel conflicting surveys to align as one.
____
References
Ludwig von Mises, The Boom Is Worse than the Bust, November 30, 2018 Mises.org
Prudent Investor, The Philippines' July
4.4% CPI: Stagflation Remains a Primary Political, Economic, and Financial Risk August 12, 2024
Prudent Investor, Philippine
Government’s July Deficit "Narrowed" from Changes in VAT Reporting
Schedule, Raised USD 2.5 Billion Plus $500 Million Climate Financing September 1,
2024
No comments:
Post a Comment