In times of banking and financial crises, central banks always intervene. This is not a law of nature, but it is an empirical law of central bank behavior. The Federal Reserve was created 110 years ago specifically to address banking panics by expanding money and credit when needed, by providing what was called in the Federal Reserve Act of 1913 an “elastic currency,” so it could make loans in otherwise illiquid markets, when private institutions can’t or won’t—Alex J. Pollock
In this issue
Why is the Philippine Banking System Burning Cash at a Rapid Rate? The Escalating Systemic Risks from Bank Financialization
I. Is the Philippine Banking "Sound"?
II. As Banks "Load the Truck" on the Consumers, Cracks in Credit Card and Salary Loans Emerge
III. If Banks are Booming, then Why the Rapid Cash Reserve Burn Rate?
IV. Why the Rapid Cash Burn Rate? Mark-to-Market Investment Losses and Disguised Deficits via Record Held-to-Maturity Assets
V. Rapid Cash Burn Rate from Declining Loans and Unpublished Delinquencies
VI. An Upcoming Choke on Bank Interest Rate Spreads? The Escalating Systemic Risks from Bank Financialization
Why is the Philippine Banking System Burning Cash at a Rapid Rate? The Escalating Systemic Risks from Bank Financialization
Despite June's massive BSP RRR cuts, the cash reserve burn rate of the Philippine Banks intensified last July. Why? Their balance sheet provides the clues.
I. Is the Philippine Banking "Sound"?
The mainstream hollers that Philippine banks are "sound." But how true is it?
When monetary authorities hold a perplexed stance on their monetary policy, could this signify "control" over the present economic and financial conditions?
The BSP has constantly been changing its mind to either raise rates or maintain the present stance, with apparent reluctance. Of course, their latent default position is "free money" or zero-bound rates, which is the foundation for their inflation-targeting policies.
So why dither?
Could it be because the financial conditions of the banking system have been exhibiting signs of increased entropy?
II. As Banks "Load the Truck" on the Consumers, Cracks in Credit Card and Salary Loans Emerge
Let us begin with the sector's most significant asset: loans.
As repeatedly emphasized here, consumer loans have been the primary thrust of bank lending operations at the expense of industry loans.
Interest rate subsidies or the interest rate cap on credit cards have contributed to this structural shift.
Last July, production loans of the total banking system accounted for a net increase of Php 581 billion YoY, a 64.1% share.
Figure 1
But supply-side loans consist of 21 subcategories. The largest three borrowers were electricity/utilities Php 117 billion, real estate Php 109.5 billion and trade Php 107.3 billion.
Though the net increase of Php 325.7 billion YoY in household loans accounted for a 35.9% share, credit card and salary loans had the highest YoY of Php 145.1 and Php 124.1 billion, respectively. (Figure 1, topmost chart) These loans exceeded that of the top industry borrowers.
The pie distribution of the aggregate production and consumer loans was 84.1% (landmark low) and 13.3% (record high) last July.
The ballooning % share disparity between the aggregate and net change demonstrates the intensity of their business model transformation.
In percentage, production loans, which posted a 6.2% growth in July, continued to decline while household loan growth steadied at 26%. Credit card loans, with 29.8% growth, soared to their second-highest growth rate after January 2023's 30.7%.
Consumers have filled the gap of their income's loss of purchasing power through increased balance sheet leveraging. Of course, this increase in demand powered by credit unfilled by supply leads to "too much money chasing too few goods" or inflation!
And so, the vicious feedback loop of borrowing to address higher prices, which results in higher prices, and vice versa.
But the headline and the CPI have recently retreated because of:
1. The pullback in production loans—partially extrapolates to reduced investments,
2. Lower fiscal deficits (from reduced volatility of public spending growth), both have led to the "surprise" 4.3% slowdown of the Q2 GDP,
3. The declining FDIs, which, along with GDP, led to lower employment rates,
4. Increased local output and imports and,
5. Growth rates of consumer loans have also peaked. Despite the vigorous consumer loan growth, it was insufficient to fill the escalating chasm from the above.
The bank's gamble with consumer spending may be about to backfire.
As of Q2 2023, though the growth of non-performing loans (NPL) salary loans has stalled, stagflationary conditions are likely to push it higher. (Figure 1, middle pane)
NPLs of credit cards appear to be bottoming. Likewise, stagflationary conditions are likely to accelerate this ratio. (Figure 1, lowest graph)
Nota Bene: The BSP relief measures have contributed immensely to the recent decline in NPLs.
III. If Banks are Booming, then Why the Rapid Cash Reserve Burn Rate?
The mainstream insists that bank profits have been booming.
Figure 2
If so, why has the growth rate of bank assets been receding?
The banking system's asset growth dived from 9.04% in June to 7.9% in July. (Figure 2, topmost chart)
Again, the following constitutes bank assets (as of July): cash (10.74%), investments (29.6%), loans (53.55%), ROPA (.5%), and other assets (5.7%). (Figure 2, second to the highest graph)
The first three accounted for 93.9% of the bank assets in July.
Also, the trend of the contributory pie per segment exhibits the transformative business model of banks.
In a nutshell, bank operations have increasingly relied on investments even as loans have started to recover, while cash continues to lose ground.
Yet, why have banks been burning cash?
What happened to the BSP's 250 bps Reserve Requirement Ratio cuts (from 12% to 9.5%) last June?
According to the central bank survey, the cuts released about Php 248 billion into the financial system through August (reserve money: liabilities to other depository corporations).
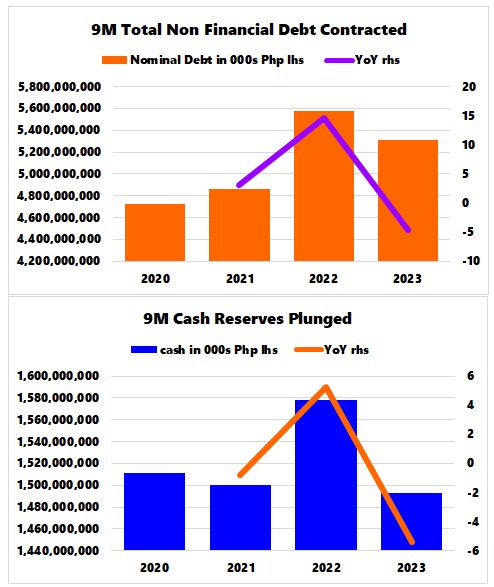
Stunningly, the banking system's cash reserves plunged 10.5% YoY or Php 289.9 billion and 13.6% MoM or Php 388.9 billion. (Figure 2, second to the lowest window)
The incredible drain brought the bank cash reserves to 2019 levels, effectively neutralizing excess liquidity from the historic BSP's 2.3 trillion injections in 2020-21!
The BSP's liquidity ratio also reflected this astounding plunge. The cash-to-deposits ratio dived from 16.11 to 14.09, while the liquid assets-to-deposits ratio also tumbled from 52.57 to 51.33 in July. (Figure 2, lowest graph)
From here, the BSP chief recently raised the prospect of halving the remaining Reserve Requirements!
A "flourishing" banking system is unlikely to experience this intense cash drain, would it?
IV. Why the Rapid Cash Burn Rate? Mark-to-Market Investment Losses and Disguised Deficits via Record Held-to-Maturity Assets
Again, why such a hemorrhage? What has been causing the rapid burn rate?
The partial short answer: decelerating growth of bank investment and loan operations.
Figure 3
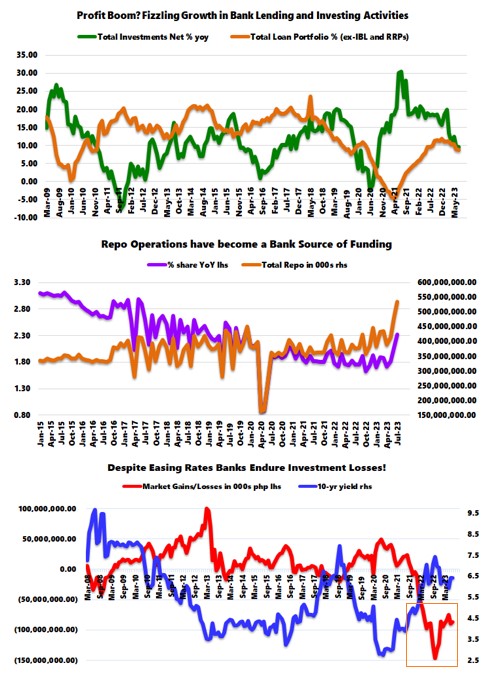
Growth of total bank investments slowed from 9.65% to 9.56% in July. Meanwhile, the Total Loan Portfolio (TLP) growth, excluding IBL and Repo transactions, moderated from 9.07% to 8.8%. (Figure 3, topmost chart)
TLP gross increased from 8.67% to 8.81%, but that's because banks have tapped the reverse repo trade with the BSP. Total reverse repos jumped from 23.3% to 42.6% in July. Banks have bridged the growing liquidity chasm from the BSP through reverse repos. (Figure 3, middle pane)
Why the diminishing bank investments?
To wit, higher rates have led to mark-to-market losses and increased Held to Maturity (HTM) assets.
Though lower rates—represented by yields of 10-year bonds—have eased the mark-to-market losses of bank investments from its record low in October 2022, the deficits remain at record levels. (Figure 3, lowest diagram)
These losses siphon liquidity from banks.
Figure 4
The more significant concern is that banks continued to amass HTMs, which reached another all-time high of Php 4.01 trillion in July.
HTMs signify a legitimate accounting legerdemain to conceal mark-to-market deficits. The benefit is that this boosts the bank's financial health via statistics. The cost is that HTMs constrain bank liquidity over the locked-in period. The diametric but nearly symmetric fluctuations of cash-to-deposit and HTMs reveal this causation. (Figure 4, topmost graph)
At any rate, the banking system continues to stockpile government securities through net claims on the central government (NCoCG), which is likely at the behest of the BSP.
Aside from Basel Capital requirements and providing direct funding to the government, banks hold Treasury securities as collateral—which the BSP uses to inject liquidity into the system.
Bank NCoCG continues to carve record after record through June, as the BSP has been moderating its operations (perhaps for the public's consumption). (Figure 4, middle and lowest charts)
So, while these may have shielded banks from the market, which has kept the industry afloat, its diminishing returns render it a "kick the can down the road" policy.
Worse, as industry misallocations accrue over time, this amplifies the myriad risks from it. HTMs are like the fabled "sword of Damocles" to the banking industry.
The gist: The backlash from BSP interventions to keep the easy money regime alive has extrapolated to bank investment losses, record HTMs, and an all-time high of NCoCGs. These reasons contribute to the banks' liquidity plight.
V. Rapid Cash Burn Rate from Declining Loans and Unpublished Delinquencies
Figure 5
Higher rates have also led to a diminishing amount of loans. (Figure 5, topmost window)
However, the BSP practices asymmetric policies. Although headline rates are high, in reality, card interest rate caps on credit cards, monetization of the government debt (QE) via NCoCG by banks and the BSP, and residual relief measures amount to credit easing measures.
The striking divergent performance between production and consumer loans is a testament—add to this, the sustained growth of public debt.
But a credit growth slowdown in an economy dependent on debt magnifies economic, unemployment, financial, and credit risks.
Dependence on money supply growth has, in essence, financialized the economy. Though M3-to-GDP has decreased from the all-time high of 79.4% in Q1 2021 to 70.5% in Q2 2023, it remains significantly above pre-pandemic levels. And the CPI has closely tracked M2 and M3-to-GDP, although with a time lag. (Figure 5, middle graph)
As earlier pointed out, salary loan NPLs have increased, while credit card NPLs may have bottomed despite the remaining relief measures.
Overall, the declining trend of bank NPLs appears to have bottomed and could pick up steam soon. Bank loan loss provisions remain above the reported Bank NPLs, which implies that banks are expecting more NPLs or manifest distortions from the various BSP relief measures. (Figure 5, lowest chart)
If the banking system uses HTMs to disguise mark-to-market losses, why not camouflage NPLs through understatement?
Banks develop dependence and the non-transparent attitude brought forward by the BSP's relief measures.
In any case, slowing loan growth and elevated NPLs consume liquidity, aside from the investment aspect, compounds the reasons for the industry's liquidity strains.
The takeaway: Mismatches from bank maturity transformation that have led to NPLs and the ensuing shortfall in liquidity conditions are manifestations of bank credit-financed malinvestments.
All these represent the unintended consequences of the extended BSP's easy money regime.
VI. An Upcoming Choke on Bank Interest Rate Spreads? The Escalating Systemic Risks from Bank Financialization
Figure 6
In the meantime, the recent rebound in loan growth has barely percolated into deposits. (Figure 6, topmost graph)
Growth of bank deposit liabilities slid from 8% to 6.5% in July on the back of dwindling peso deposits from 8.4% to 6.5%. FX deposits grew by 6.1%, which increased from June's 5.7%. (Figure 6, middle pane)
Aside from the government, banks are the second principal FX borrowers with a 16.3% share in Q2 2023, according to the BSP's external debt data.
Not only has deposit growth been derailed by high rates and rising debt loads, but following the latest bounce, the recent downdraft has reaffirmed its downtrend.
The bank's decaying cash reserves reflect the declining deposit growth rate. (Figure 6, lowest graph)
Figure 7
Aside from repo operations and BSP securities (quasi-repo), banks have relied on short-term T-bills for funding. (Figure 7, topmost graph)
Higher rates, lower volume, and rising funding costs extrapolate to a likely squeeze on interest rate spreads and margins. That's aside from the higher risks of NPLs and a more defensive stance of banks (tightening) despite the BSP moves to ease credit conditions.
In the end, with banks in a precarious position, the financialization of the economy parlays into the concentration of the nation's total financial resources towards banks, increasing systemic risks.
Yes, the banking system has quasi-monopolized the financial system by controlling 82.65% of the Php 29.004 trillion total financial resources (as of June). (Figure 7, lower chart)
Since the banking system has grown to a "too big to fail" industry, the path-dependent policy position of authorities is to keep feeding it with liquidity at the heightened risk of stagflation (even hyperinflation) and or the collapse of the peso.
Or differently, since the market economy represents a process, the reiterative feedback loops from such policies should reinforce these hazards.
Otherwise, should authorities refrain from this path, the economy should fall into a deep recession, which would clear out malinvestments, thereby purifying the balance sheet of the political economy and allowing it to restart with a relatively clean slate.
These would be the hallmark of the forthcoming boom.