Central banks and finance
ministries do not hold copper, aluminum, or steel supplies, yet they hold gold.
The only explanation for central bank gold hoards is the obvious one - gold is
money― James Rickards
In this issue
BSP’s Gold Reserves Policy: A Precursor to a Higher USD-PHP Exchange Rate?
I. BSP’s Contradicting Official Statements
II. Why the Rhetorical Shift? World’s Largest Gold Seller in 2024—BSP
III. BSP’s Gold Sales: Supporting the USD-PHP Soft Peg
IV. Other Reserve Assets (ORA) and Financial Derivatives:
Did the BSP Short Gold?
V. Broader Economic Pressures: 11-Year High January Balance
of Payments (BoP) Deficit and Soaring External Debt
VI. Signaling Channel: The BSP’s Softening Rhetorical
Stance on the USDPHP Cap
VII. Conclusion: Inevitable Devaluation of the Philippine Peso?
BSP’s Gold Reserves Policy: A Precursor to a Higher USD-PHP Exchange Rate?
The BSP’s gold reserves have been shrinking since 2020, ultimately contributing to the devaluation of the Philippine peso. The BSP sold the most gold in 2024—how low will the peso fall?
I. BSP’s Contradicting Official Statements
So, the BSP’s caught up in the wild storm of election season, and guess what? They’re back at it, defending their whole deal with gold reserves.
BSP, February 24: "The country’s GIR is not used for any other purpose other than meeting the country’s forex requirements. Tasked to manage the country’s external accounts, among other functions, the BSP has been buying and selling gold over the years as part of its core functions. When the BSP sells gold, the proceeds revert to and stay within the GIR. Last year, the GIR rose to USD 106.3 billion from USD 103.8 billion in 2023. Similar to other central banks, the BSP maintains a portion of its reserves in gold as part of the country’s GIR mostly to hedge against/offset movements in the market price of other assets. It buys or sells gold to maintain an optimum level for this purpose, not too much, not too little. This follows basic portfolio-management principles. Gold prices tend to move in the opposite direction of other assets. Therefore central banks hold some gold as a hedge against price declines in other assets in the reserves. However gold prices can be volatile, earns little interest, and has storage costs, so central banks don’t want to hold too much." (bold added)
Back in September, after basking
in the limelight, the BSP defended its decision to sell gold.
BSP, September 24, 2024: "The Bangko Sentral ng Pilipinas (BSP) sold gold during the first half of the year as part of its active management strategy of the country’s gold reserves, which form part of the country’s Gross International Reserves (GIR). The BSP took advantage of the higher prices of gold in the market and generated additional income without compromising the primary objectives for holding gold, which are insurance and safety." (bold added)
There is a stark shift in the BSP’s stance on gold reserves. Earlier, they described gold as essential for "insurance and safety," yet last month they’ve characterized it as a "dead asset" that "earns little interest and has storage costs."
II. Why the Rhetorical Shift? World’s Largest Gold Seller in 2024—BSP

Figure 1
The World Gold Council (WGC) noted that the BSP "confirmed its gold sales—totaling 30 tonnes"—the largest sale by a central bank in 2024. (Figure 1, upper image)
While some other central banks also sold gold, their sales were on a significantly smaller scale.
Globally, central banks were net buyers in 2024, particularly emerging market central banks. The WGC reported that "Central banks added 1,045 tonnes to global gold reserves in 2024."
Since the 2008 financial crisis, global central banks have been rebuilding reserves. (Figure 1, lower pane)

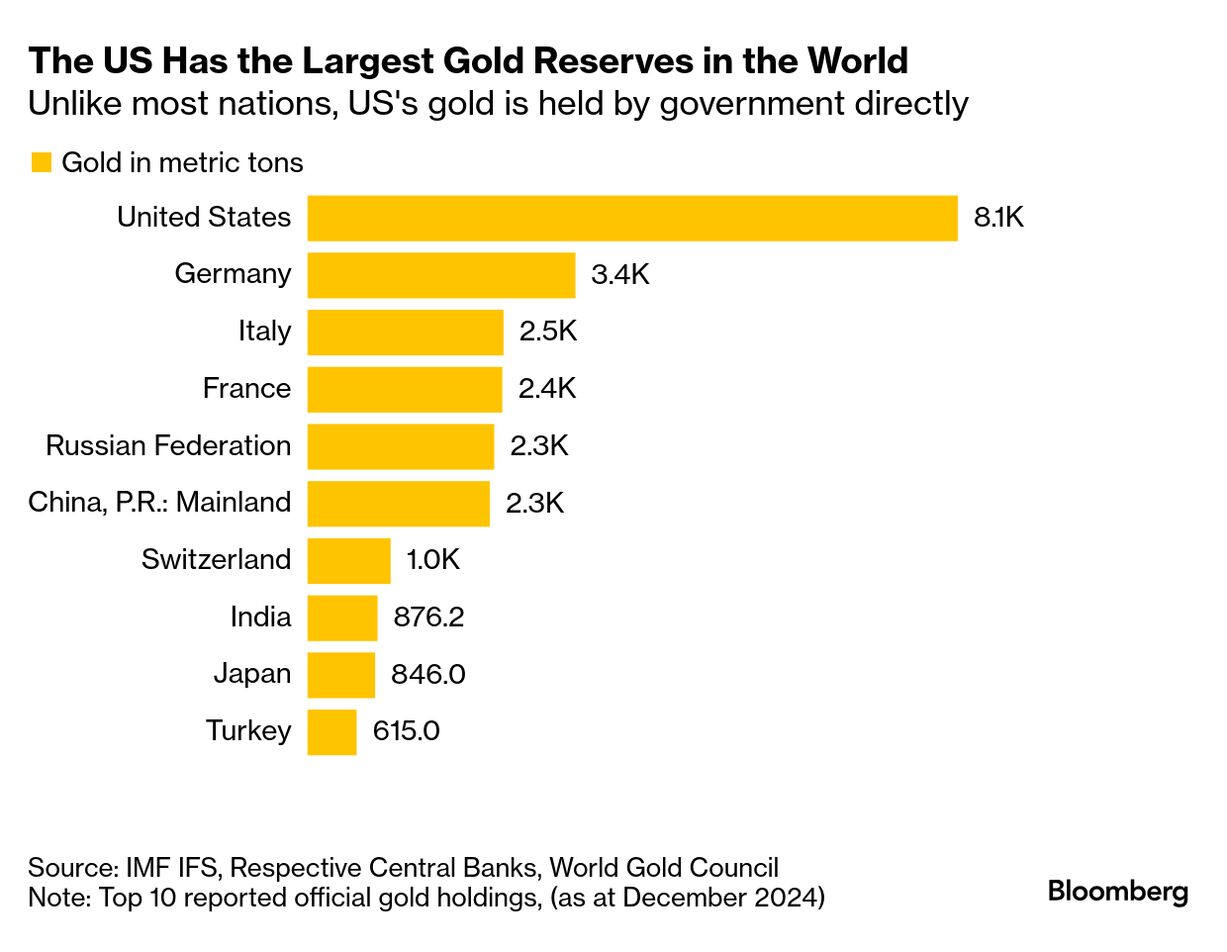
Figure 2
Notably, China’s PBOC and the Central Bank of India were among the most aggressive buyers—not just in 2024, but for several years. (Figure 2, upper window)
Alongside Russia, their gold holdings have matched or even exceeded those of some developed nations, closing the gap with the US. (Figure 2, lower chart—excludes unpublished holdings)
Given this trend, BSP’s claim that "central banks don’t want to hold too much" appears misleading—an appeal to the false majority (argumentum ad populum).
It seems more like an attempt to justify its selling spree rather than reflect actual central bank behavior globally.
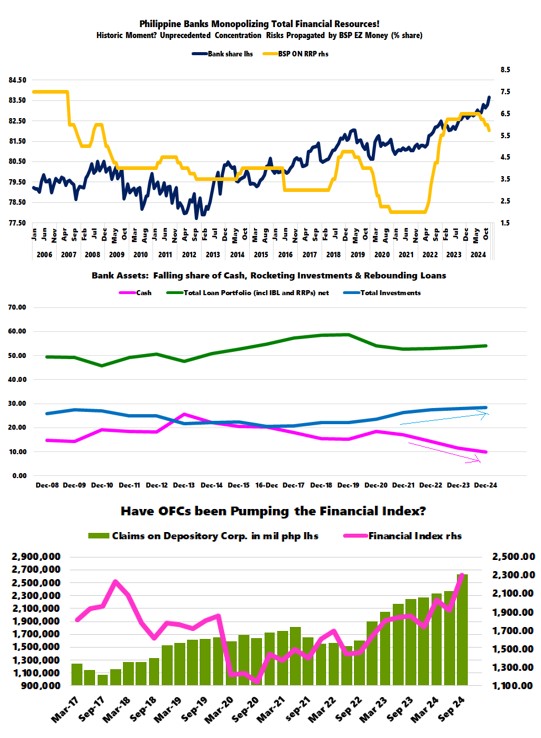
III. BSP’s Gold Sales: Supporting the USD-PHP Soft Peg
As part of its "active management strategy," the BSP has been selling gold to finance the USD-PHP soft peg, capping the exchange rate at 59 per USD. This is not just about portfolio rebalancing—it’s a deliberate move to influence the USDPHP exchange rate.
But that’s not the whole story.
There are costs to this approach. Central banks are political
institutions and are not driven by profit-and-loss activities. When the BSP
came under scrutiny for its aggressive selling, not only did they stop, but
they also started repurchasing gold in August—at much higher
prices. In essence, they sold high but bought higher, leading to opportunity
losses.

Figure 3
Despite recent incremental purchases, BSP’s gold reserves remain at their lowest level since at least 2019, according to BSP and IMF’s data template on International Reserves and Foreign Currency Liquidity (IRIFCL) data.
Data further highlights historical trends, including BSP’s two waves of gold sales. (Figure 3, topmost graph)
First Wave (2020-2021 Pandemic Recession): BSP sold gold even as the USD-PHP was weakening. This suggests it anticipated the pesos’ depreciation.
Second Wave (Nov 2023 - July 2024): Gold sales preceded another test of the USD-PHP 59 level in June 2024, implying an effort to manage exchange rate volatility.
Despite record-high gold prices, BSP’s overall reserves increased due to valuation gains rather than inventory growth. (Figure 3, middle diagram)
In any case, the all-time high in gold prices has led to an increase in gold’s share of the GIR, reaching 2020 levels. (Figure 3, lowest image)
On the other hand, the BSP’s demonstrated preference for gold sales reveals its dogmatic proclivities, which barely acknowledges gold as a function of ‘insurance and safety.’
Still, despite a reduction in inventory, the BSP owes a significant share of its GIR to gold prices.
IV. Other Reserve Assets (ORA) and Financial Derivatives: Did the BSP Short Gold?

Figure 4
Beyond public external borrowings, (Figure 4, topmost graph) which bolster the GIR through National Government deposits with the BSP, Other Reserve Assets (ORA) have played a prominent role since 2018.
ORA has been rising since January 2024, when the BSP accelerated its gold sales. (Figure 4, middle window)
ORA has played a conspicuous role in the USDPHP. Its surge from 2018 to 2020 coincided with the fall of the USDPHP, and vice versa (Figure 4, lowest chart)
ORA includes:
-Mark-to-market financial derivatives (forwards, futures, swaps,
options)
-Forwards and options on gold
-Short-term foreign currency loans
-Other financial assets used for immediate liquidity
-Repo assets
This raises key questions:
-Has BSP been ‘shorting’ gold via ORA while conducting physical sales to settle delivery?
-Is BSP boosting its reserves with derivatives and repos via transactions with international financial intermediaries, particularly US-based institutions?
While the BSP claims that gold "earns little interest and has storage costs," financial derivatives also incur commissions and fees, which are paid to banks, brokers, and dealers. These costs include premiums on options and other transaction fees.
-Why has the BSP been prioritizing financial derivatives and repos over gold, which serves as "insurance and safety"? Are these instruments not costlier and riskier?
-Has geopolitics influenced the BSP’s decision-making trade-offs? Aside from its geopolitical alignment with the U.S., could this shift toward Wall Street-linked instruments be connected to the Philippines' removal from the FATF’s money laundering grey list?
To sum up, has the BSP’s increasing use of financial leverage to sustain the USDPHP soft peg led to diminishing returns? And is its shrinking gold stock a symptom of this trend?
V. Broader Economic Pressures: 11-Year High January Balance of Payments (BoP) Deficit and Soaring External Debt
Yet more symptoms.
BSP, February 19: "The country’s overall balance of payments (BOP) position posted a deficit of US$4.1 billion in January 2025, higher than the US$740 million BOP deficit recorded in January 2024. The BOP deficit in January 2025 reflected the Bangko Sentral ng Pilipinas’ (BSP) net foreign exchange operations and drawdowns by the national government (NG) on its foreign currency deposits with the BSP to meet its external debt obligations."

Figure 5
That is, the January BoP deficit widened to an 11-year high! Ironically, the NG raised USD 3.3 billion in January. This suggests that the BOP deficit largely reflects the net cost of defending the USDPHP soft peg. Remarkable!
Additionally, Bureau of Treasury data shows that external debt in peso terms—partially reflecting devaluation—continues to surge, growing 11.4% year-over-year, with its uptrend dating back to 2012
FX debt servicing costs (interest and amortization) skyrocketed 47.5% in 2024, increasing its share of total debt to 22.9%, confirming a trend reversal in 2023.
Be reminded: This debt buildup wouldn’t have been necessary had there been sufficient organic FX revenue (e.g., remittances, tourism, service exports, FDI and etc.).
VI. Signaling Channel: The BSP’s Softening Rhetorical Stance on the USDPHP Cap
With declining gold reserves and mounting external pressures, peso devaluation appears increasingly likely.
Inquirer.net, February 15: "A peso fall to the 60-level against the US dollar remains “a possibility” despite the Bangko Sentral ng Pilipinas’ (BSP) decision to hold rates steady, Governor Eli Remolona Jr. said, adding that hitting the pause button on easing was the “less disruptive” action for the market." (bold added)
This media communication represents the "signaling channel" approach—where central bankers use public messaging to condition market expectations.
Foreign institutions have begun forecasting a breach of the 59-peso level:
Sunlife:
61
Bank
of America: 60
Maybank:
63
BMI:
Above 60
HSBC: Beyond 59
These are hardly typical forecasts or implicit pressure on the BSP; rather, they seem part of the signaling effort in shaping the Overton Window.
The USDPHP exchange rate operates under a ‘soft peg’ regime, meaning the BSP will likely determine the next upper band or ceiling. In the previous adjustment, the ceiling rose from 56.48 in 2004 to 59 in 2022, representing a 4.5% increase. If history rhymes, the next likely cap could be in the 61-62 range.
VII. Conclusion: Inevitable Devaluation of the Philippine Peso?
BSP’s evolving stance on gold raises fundamental questions about its broader strategy. Its aggressive sales, followed by reactive repurchases at higher prices, suggest a focus on short-term currency stabilization—driven by sensationalist politics—rather than strategic reserve management.
At the same time, the increasing reliance on derivatives and external debt amplifies long-term financial risks.
Moreover, the BSP appears less committed to defending the 59 level, as indicated by both its rhetoric and evolving fundamentals, including declining gold reserves.
With external pressures mounting, peso devaluation seems not a matter
of IF but WHEN.


