Sunday, March 02, 2025

Mounting Cracks in the PSEi 30: How Structural Imbalances Are Amplifying Market Stress


True confidence does not come from “you can trust us if we screw up because someone else will bail you out” but from “you can trust us because it is demonstrably in our interest to make sure we don’t screw up”. Deposit insurance is an inferior confidence product – one might even say, a confidence trick—Kevin Dowd 

In this issue

Mounting Cracks in the PSEi 30: How Structural Imbalances Are Amplifying Market Stress

I. The PSEi 30’s February and 2025 Performance

II. PSE’s Market Internals Remain Bearish

III. Is This a Regional Trend? Emerging Signs of Asian Financial Crisis 2.0?

IV. PSEi 30’s Mounting Market Imbalances

V. Symptoms of Capital Consumption: Despite Surging Credit Expansion, Falling Liquidity and Diminishing Returns

VI. Share Buybacks as Panacea?

VII. The Path to Full-Fractional Reserve Banking and Deposit Insurance Expansion: A False Sense of Security? 

Mounting Cracks in the PSEi 30: How Structural Imbalances Are Amplifying Market Stress 

The erosion of a major rally this February following January’s selloff reveals the underlying structural fragilities and operating dynamics of the Philippine Stock Exchange.

I. The PSEi 30’s February and 2025 Performance


Figure 1

Echoing January’s 4.01% end-of-month selloff, the final trading day of February saw a similar 2.06% pre-closing plunge, erasing nearly half of the recovery gains the PSEi 30 had posted for the month. (Figure 1, upper and lower images)

While it may be convenient to attribute this last-minute market move to portfolio rebalancing, it primarily reflected underlying trend weakness and growing fragility in the PSEi 30.

A portion of January 2025’s selloff was driven by changes in PSEi membership.

In contrast, February’s decline was largely fueled by massive foreign money outflows.

Despite this, the headline index ended February up 2.31% month-over-month (MoM), yet remained down 13.63% year-over-year (YoY) and was still 8.13% lower year-to-date (YTD) in 2025.

II. PSE’s Market Internals Remain Bearish

Why do internal market activities signal a bearish backdrop?


Figure 2

1. Weak Volume Trend

Despite a 7.6% improvement in the PSE’s two-month gross volume, it marked the third-lowest level since 2012, reinforcing a volume downtrend that has persisted since 2015. The 2021 volume spike—an anomaly fueled by the Bangko Sentral ng Pilipinas (BSP)’s Php 2.3 trillion historic injections into the financial system—merely highlighted the short-lived effects of the banking system’s pandemic-era rescue. (Figure 2, topmost diagram)

2. Broad-Based Selling Pressure

The two-month selling spree has been widespread. Market breadth, as measured by the advance-decline spread, recorded its second-worst performance since the pandemic crash of March 2020. (Figure 2, middle graph)

3 Persistent Foreign Outflows

In 2025, foreign outflows accounted for the third-largest capital exodus since 2012. Foreign trade made up 50.8% of gross volume, highlighting that selling pressure in the PSEi 30 was exacerbated by weak local investor support. Foreign capital has played the role of the marginal price setter, and its exit underscores the lack of domestic buying power or the dearth of local savings. (Figure 2, lowest chart) 

III. Is This a Regional Trend? Emerging Signs of Asian Financial Crisis 2.0?

Figure 3

The sustained foreign money outflow suggests that the phenomenon extends beyond the Philippines.

In 2025, the PSEi 30 ranked as the third-worst-performing equity benchmark in Asia. (Figure 3 topmost and middle graphs)

More broadly, the four largest ASEAN indices have exhibited pronounced weakness since Q3 2024.

If this trend continues, it could lay the groundwork for a potential Asian Financial Crisis 2.0

IV. PSEi 30’s Mounting Market Imbalances 

A deeper look at the PSEi 30 reveals intensifying distortions: 

The Financial Index/PSEi 30 has surged to consecutive all-time highs, reflecting massive outperformance since the BSP's historic banking sector rescue during the pandemic recession. (Figure 3, lowest pane) 

Conversely, the Property Index/PSEi 30, representing banks’ largest clients, has plunged to its lowest level since 2012. In other words, most of the selling pressure in the PSEi 30 has emanated from this sector.


Figure 4

The cumulative free float shares of the three largest banks have hit all-time highs as of February 28, suggesting that without intervention from the so-called “national team,” the PSEi 30 would have been substantially lower. (Figure 4, topmost image)

V. Symptoms of Capital Consumption: Despite Surging Credit Expansion, Falling Liquidity and Diminishing Returns

Despite back-to-back record highs in systemic leveraging—measured by the combined growth of universal commercial bank loans and public debt in pesos—the PSEi 30 continues to suffer from diminishing YoY returns. (Figure 4, middle image) 

This is also reflected in the banking system’s all-time low cash-to-deposits ratio, a key liquidity measure. (Figure 4, lowest window) 

The broader implication is clear: massive liquidity injections via credit expansion have led to capital consumption rather than productive investment. This is evident in the declining productivity rate of the economy and diminishing returns on stock market investments

It is also misleading to blame the PSE’s underperformance on local investors shifting to foreign assets such as offshore stocks or cryptocurrencies. While it may be true for some, the more pressing issue is the depletion of domestic savings.

VI. Share Buybacks as Panacea?

So, how does the establishment help resolve this predicament? While they might claim their shares are "undervalued"—indicating a perceived 'market failure'—Metro Pacific, for instance, opted to delist.


Figure 5

SM Investments made a similar claim while observing their diminishing clout, reflected by their declining share of the free float capitalization in the PSEi 30. 

In response, they recently launched a P60 billion share buyback program, "the largest ever announced by a Philippine corporation," aimed at purchasing an estimated 77 million shares, or 6% of the company's outstanding shares. 

Could this, however, signal a panic reaction? 

Some listed companies use their shares as collateral for loans or as currency in the context of mergers, often with price floors stipulated in their covenants. 

VII. The Path to Full-Fractional Reserve Banking and Deposit Insurance Expansion: A False Sense of Security? 

This fragility dilemma is further aggravated by the BSP’s recent reserve requirement ratio (RRR) cuts—and strikingly, the central bank is now proposing a transition to FULL fractional reserve banking, with plans to lower the RRR to ZERO. 

We previously discussed it here. 

The Philippines is NOT the U.S., which can afford zero RRR rates due to its deep and diversified capital markets. 

In contrast, systemic risks in the Philippines are being amplified as banks have increasingly monopolized the nation’s total financial resources, leaving the economy vulnerable to liquidity shocks and credit misallocation 

Meanwhile, the Philippine Deposit Insurance Corporation (PDIC) has doubled its maximum deposit insurance coverage. However, this comes at a time when the rate of qualified deposits continues to decline.


Figure 6
 

As of Q3 2024: 

-Total insured deposits had been trending downward since 2011, reaching just 18.3% of total deposits. (Figure 6, upper chart) 

-Of this, only 9.83% were fully insured, while 8.4% were partially insured. 

Although this decline is attributed to aggressive bank credit expansion, which has inflated deposit levels, it has barely delivered a proportional increase in deposits. 

As an aside, it is unclear how much in assets the PDIC has to support such claims. 

VIII. In Summary: Intensifying Imbalances and Amplified Volatility; Opportunity? Mining Index 

The PSEi 30’s performance in 2025 reflects worsening structural imbalances, manifested through magnified volatility. 

To be sure, while fierce bear market rallies can occur, this does not mean that rising prices will eliminate these risks. 

Here’s what we’re watching: one key development has been gold’s record-breaking surge. 

If this trend continues, it could help provide a boost to the mining index, which has been quietly gaining upside momentum at the margins. (Figure 6, lowest pane) 

This represents a fringe (or niche) opportunity with potential. 

Nota bene: This article offers market insights but does not constitute a recommendation or call to action. 

Sunday, February 23, 2025

BSP’s Aggressive RRR Cuts: A High-Stakes Gamble?


If there is one common theme to the vast range of the world’s financial crises, it is that excessive debt accumulation, whether by the government, banks, corporations, or consumers, often poses greater systemic risks than it seems during a boom. Infusions of cash can make a government look like it is providing greater growth to its economy than it really is. Private sector borrowing binges can inflate housing and stock prices far beyond their long-run sustainable levels and make banks seem more stable and profitable than they re­ally are. Such large-scale debt buildups pose risks because they make an economy vulnerable to crises of confidence, particularly when debt is short term and needs to be constantly refinanced—Carmen Reinhart and Kenneth Rogoff 

In this issue

BSP’s Aggressive RRR Cuts: A High-Stakes Gamble?

I. Decline in 2024 Bank Non-Performing Loans Amidst Record-High Debt Levels and a Slowing Economy

II. Deepening Financialization: Financial Assets Surge in 2024 as Banks Drive Industry Monopolization

III. Viewing Bank’s Asset Growth Through the Lens of the PSE

IV. March 2025 RRR Cuts and the Liquidity Conundrum: Unraveling the Banking System’s Pressure Points

V. Liquidity Drain: Record Investment Risks and Elevated Marked-to-Market Losses

VI. Despite Falling Rates, Bank’s Held-to-Maturity Assets Remain Near Record High

VII. Moral Hazard and the "COVID Bailout Playbook"

VIII. The Bigger Picture: Are We Headed for a Full-Blown Crisis?

IX. Conclusion: RRR Cuts a High-Risk Strategy? 

BSP’s Aggressive RRR Cuts: A High-Stakes Gamble?

The BSP announced another round of RRR cuts in March amid mounting liquidity constraints. Yet, the reduction from 20% in 2018 to 7% in 2024 has barely improved conditions. Will this time be different?

I. Decline in 2024 Bank Non-Performing Loans Amidst Record-High Debt Levels and a Slowing Economy

Inquirer.net, February 14, 2025: Soured loans held by Philippine banks as a ratio of total credit eased to their lowest level in a year by the end of 2024 as declining interest rates and softer inflation helped borrowers settle their debts on time. However, a shallower easing cycle might keep financial conditions still somewhat tight, which could prevent a big decline in bad debts this year. Preliminary data from the Bangko Sentral ng Pilipinas (BSP) showed the gross amount of nonperforming loans (NPLs)—or credit that is 90 days late on a payment and at risk of default—had cornered 3.27 percent of the local banking industry’s total lending portfolio as of December, down from November’s 3.54 percent. That figure—also known as the gross NPL ratio—was the lowest since December 2023, when bad loans accounted for 3.24 percent of banks’ total loan book.

An overview of the operating environment 

In any analysis, it is crucial to understand the operating environment that provides context to the relevance of a statistic in discussion.

The Bangko Sentral ng Pilipinas (BSP) initiated its ‘easing cycle’ in the second half of 2024, which included three rate cuts and a reduction in the reserve requirement ratio (RRR). Meanwhile, inflation (CPI) rebounded from a low of 1.9% in September to 2.9% in December. Additionally, the BSP tightened its cap on the USDPHP exchange rate. Fiscal spending over the first 11 months of the year reached an all-time high.

Yet, there are notable contradictions.

Despite record-high bank lending—driven largely by real estate and consumer loans—GDP growth slowed to 5.2% in the second half of 2024 primarily due to the weak consumer spending. The employment rate was also near an all-time high.


Figure 1

Meanwhile, real estate prices entered deflationary territory in Q3, with the sector’s real GDP growth falling to its lowest level since the pandemic-induced recession. Its share of total GDP also dropped to an all-time low. 

Notably, the real estate sector remains the largest borrower within the banking system (encompassing universal, commercial, thrift, and rural/cooperative banks). (Figure 1, topmost chart) This data depends on the accuracy of the loans reported by banks. 

However, despite recent rate cuts and significant reductions in RRR, the sector remains under pressure. Additionally, sluggish GDP growth suggests mounting risks associated with record levels of consumer leverage. 

Upon initial analysis, the decline in non-performing loans (NPLs) appears inconsistent with these economic developments. Gross NPLs dropped to one-year lows, while net NPLs reached levels last seen in June 2020. (Figure 1, middle window) 

Ironically, the BSP also announced another round of RRR cuts this March.

II. Deepening Financialization: Financial Assets Surge in 2024 as Banks Drive Industry Monopolization

Let's now turn to the gross assets of the financial system, also known as Total Financial Resources (TFR).

The BSP maintained its policy rate this February.

Ironically, BSP rates appear to have had little influence on the assets of the bank-financial industry. 

In 2024, TFR surged by 7.8% YoY, while bank resources jumped 8.9%, reaching record highs of Php 33.78 trillion and Php 28.255 trillion, respectively. 

Why does this matter? 

Since the BSP started hiking rates in April 2022, TFR and bank financial resources have posted a 9.7% and 10.9% compound annual growth rate (CAGR), respectively. In short, the growth of financial assets has accelerated despite the BSP’s rate hikes. 

Or, the series of rate hikes have barely affected bank and financial market operations. 

By the end of 2024, TFR stood at 128% of headline GDP and 152% of nominal GDP, while bank resources accounted for 107% and 127%, respectively. This reflects the increasing financialization of the Philippine economy—a growing reliance on credit and liquidity—as confirmed by the Money Supply (M series) relative to GDP. (Figure 1, lowest image)

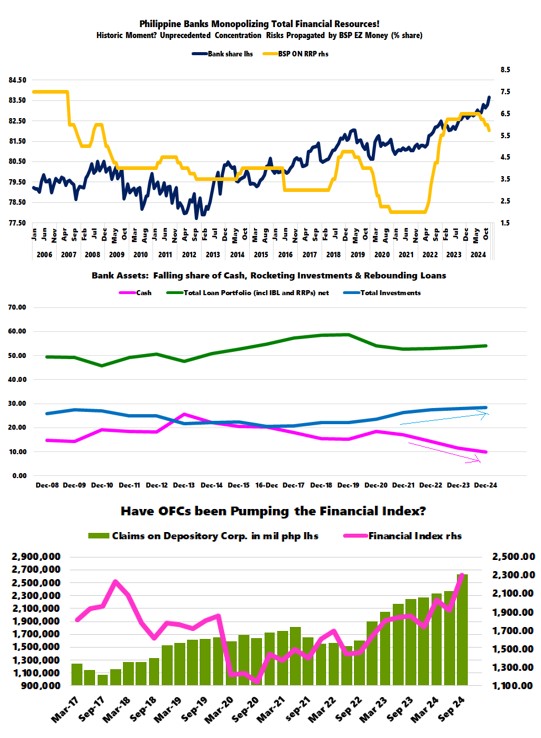
Banking Sector Consolidation


Figure 2

More importantly, the rate hikes catapulted the bank's share of the TFR from 82.3% in 2023 to an all-time high of 83.64% in 2024, powered by universal and commercial banks, whose share jumped from 77.6% to 78.3%! (Figure 2, topmost diagram) 

Effectively, the banking industry—particularly UCBs—has been monopolizing finance, leading to greater market concentration, which translates to a build-up in systemic concentration risk. 

As of December 2024, bank assets were allocated as follows: cash, 10%; total loan portfolio (inclusive of interbank loans and reverse repurchase agreements), 54%; investments, 28.3%; real and other properties acquired, 0.43%; and other assets, 7.14%. 

In 2024, the banking system’s cash reserves deflated 6.01% YoY, while total loans and investments surged by 10.74% and 10.72%, respectively. 

Yet over the years, cash holdings have declined (since 2013), loan growth has been recovering (post-2018 hikes), and investments have surged, partially replacing both. (Figure 2, middle image) 

Notably, despite the BSP’s historic liquidity injections, banks' cash reserves have continued to erode. 

The catch-22 is that if banks were profitable, why would they have shed cash reserves over the years? 

Why the series of RRR cuts? 

III. Viewing Bank’s Asset Growth Through the Lens of the PSE 

During the Philippine Stock Exchange Index (PSEi) 30’s run-up to 7,500, Other Financial Corporations (OFCs)—potentially key players in the so-called "national team"—were substantial net buyers of both bank and non-bank equities. 

BSP, January 31, 2025: "The q-o-q rise in the other financial corporations’ domestic claims was attributable to the increase in its claims on the depository corporations, the other sectors, and the central government. In particular, the other financial corporations’ claims on the depository corporations grew as its holdings of bank-issued debt securities and equity shares increased.  Likewise, the sector’s claims on the other sectors grew as its investments in equity shares issued by other nonfinancial corporations and loans extended to households expanded. The growth in the OFCs’ domestic claims was further supported by the rise in the sector’s investments in government-issued debt securities" (bold added)

The OFCs consist of non-money market investment funds, other financial intermediaries (excluding insurance corporations and pension funds), financial auxiliaries, captive financial institutions and money lenders, insurance corporations, and pension funds.

In Q3 2024, claims on depository corporations surged 12% YoY, while claims on the private sector jumped 8%, both reaching record highs in nominal peso terms.

Meanwhile, the PSEi and Financial Index surged 15.1% and 23.4%, respectively. The Financial Index hit an all-time high of 2,423.37 on October 21st, and as of this writing, remains less than 10% below that peak. The Financial Index, which includes seven banks (AUB, BDO, BPI, MBT, CBC, SECB) and the Philippine Stock Exchange (PSE) as the sole non-bank component, has cushioned the PSEi 30 from a collapse. (Figure 2, lowest chart)


Figure 3

It has also supported the PSEi 30 and the PSE through the private sector claims. (Figure 3, topmost pane)

The irony is that OFCs continued purchasing bank shares even as the banking sector’s profit growth (across universal-commercial, thrift, and rural/cooperative banks) materially slowed (as BSP’s official rates rose)

In 2024, the banking system’s net profit growth fell to 9.8%, the lowest in four years. (Figure 3, middle chart)

Meanwhile, trading income—despite making up just 2.2% share of total operating income—soared 78.3% YoY. 

The crux is that the support provided to the Financial Index by the OFCs may have enabled banks to increase their asset base via their ‘investment’ accounts, while simultaneously propping up the PSEi 30. 

Yet, this also appears to mask the deteriorating internal fundamentals of Philippine banks. (Figure 3, lowest graph) 

There are several possibilities at play: 

1. The BSP’s influence could be a factor;

2. Banks may have acted like a cartel in coordinating their actions

3. The limited depth of Philippine capital markets may have forced the industry’s equity placements into a narrow set of options.

But in my humble view, the most telling indicator? Those coordinated intraday pumps—post-recess "afternoon delight" rallies and pre-closing floats—strongly suggest synchronized or coordinated activities.

The point of this explanation is that Philippine banks and non-bank institutions appear to be relying on asset inflation to boost their balance sheets. 

Aside from shielding banks through liquidity support for the real estate industry, have the BSP's RRR cuts also been designed to boost the PSEi 30?

IV. March 2025 RRR Cuts and the Liquidity Conundrum: Unraveling the Banking System’s Pressure Points 

Philstarnews.com, February 22, 2025: The Bangko Sentral ng Pilipinas (BSP) surprised markets yesterday as it announced another major reduction in the amount of deposit banks are required to keep with the central bank. The BSP said it would reduce the reserve requirement ratios (RRR) of local banks, effective March 28, to free up more funds to boost the economy.  “The BSP reiterates its long-run goal of enabling banks to channel their funds more effectively toward productive loans and investments. Reducing RRRs will lessen frictions that hinder financial intermediation,” the central bank said…The regulator slashed the RRR for universal and commercial banks, as well as non-bank financial institutions with quasi-banking functions (NBQBs) by 200 basis points, to five percent from the current level of seven percent. 

The BSP last reduced the reserve requirement ratio (RRR) on October 25, 2024. With the next cut taking effect on March 28, 2025, this marks the fastest and largest RRR reduction in recent history.

In contrast, the BSP previously cut RRR rates from 18% to 14% over an eight-month period between May and December 2019.

Why the RRR Cuts if NPLs Are Not a Concern?


Figure 4

BSP’s balance sheet data from end-September to November 2024 shows that the RRR reduction led to a Php 124.5 billion decline in Reserve Deposits of Other Depository Corporations (RDoDC)—an estimate of the liquidity injected into the system. The downtrend in bank reserves since 2018 reflects the cumulative effect of these RRR cuts.  (Figure 4, topmost image)

Yet, despite the liquidity injection, the banking system’s cash and due-from-bank deposits continued to decline through December. It has been in a downtrend since 2013. (Figure 4, middle pane)

Cash reserves dropped 6% in 2024, marking the third consecutive annual decline. The BSP’s 2020-21 historic Php 2.3 trillion injection has largely dissipated.

Since peaking at Php 3.572 trillion in December 2021, cash levels have fallen by Php 828 billion to Php 2.743 trillion in December 2024—essentially returning to 2019 levels.  (Figure 4, lowest chart)


Figure 5

The BSP’s other key liquidity indicator, the liquid assets-to-deposits ratio has also weakened, resonating with the cash reserve trend. This decline, which began in 2013, was briefly offset by the BSP’s historic Php 2.3 trillion liquidity injection but has now resumed its downward trajectory. (Figure 5, topmost diagram) 

Other Factors Beyond Cash and Reserves

The slowdown isn’t limited to cash reserves. 

Deposit growth has also decelerated since 2013, despite reaching record highs in peso terms. Ironically, a robust 12.7% rebound in bank lending growth (excluding interbank loans and repos) in 2024, which should have spurred deposit growth, failed to translate into meaningful gains. Peso deposits grew by just 7% in 2024. (Figure 5, middle pane) 

The question arises: where did all this money go? 

This brings attention back onto the BSP’s stated goal of "enabling banks to channel funds more effectively toward productive loans and investments." This growing divergence between total loan portfolio growth and peso deposit expansion in the face of RRR cuts—20% before March 2018, now down to just 7% last October—raises further questions about its effectiveness in boosting productive lending and investment.

A Deeper Liquidity Strain: Rising Borrowings

Adding to signs of the increasing liquidity stress, bank borrowings hit an all-time high in 2024, both in gross and net terms. (Figure 5, lowest graph)


Figure 6

Total borrowings surged by Php 394.5 billion, pushing outstanding bank debt to a record Php 1.671 trillion.

More importantly, the focus of borrowing was in bill issuance, which accounted for 65% of total bank borrowings in 2024 (!)—a strong indicator of tightening liquidity. (Figure 6, topmost image)

If banks are highly profitable and NPLs are not a major issue, why are they borrowing so aggressively and requiring additional RRR cuts?

The liquidity squeeze cannot be attributed solely to RRR levels alone—otherwise, the 2018–2020 cut from 20% to 12% should have stemmed the tide.

V. Liquidity Drain: Record Investment Risks and Elevated Marked-to-Market Losses

There’s more to consider.

Beyond lending, bank investments—another key bank asset class—also hit a record high in peso terms in 2024.

Yet, despite lower fixed-income rates, banks continued to suffer heavy losses on their investment portfolios: Accumulated investment losses stood at Php 42.4 billion in 2024, after peaking at Php 122.85 billion in 2022. (Figure 6, middle diagram)

Banks have now reported four consecutive years of investment losses.

These losses undoubtedly strain liquidity, but what’s driving them?

The two primary investment categories—Available-for-Sale (AFS) and Held-to-Maturity (HTM) securities—accounted for 40% and 52.6% of total bank investments, respectively.

Accumulated losses likely stem from AFS positions, reflecting volatility in equity, fixed-income, foreign exchange, and other trading activities.

VI. Despite Falling Rates, Bank’s Held-to-Maturity Assets Remain Near Record High

Interestingly, despite easing fixed-income rates, HTM assets remained close to their all-time high at Php 3.95 trillion in December 2024, barely below the December 2023 peak of Php 4.02 trillion.

Since January 2023, HTM holdings have hovered tightly between Php 3.9 trillion and Php 4 trillion.

Government Financing and Liquidity Risks

Yet, this plateau may not persist.

Beyond RRR cuts, the banking system’s Net Claims on Central Government (NCoCG) surged 7% to a new high of Php 5.541 trillion in December 2024.

Per BSP: "Net Claims on CG include domestic securities issued by, and loans extended to, the central government, net of liabilities such as deposits."

While this is often justified under Basel III capital adequacy measures, in reality, it functions as a quasi-quantitative easing (QE) mechanism—banks injecting liquidity into the financial system by financing the government.

The likely impact?

The losses in government securities are categorized as HTMs, effectively locking away liquidity.

BSP led Financial Stability Coordination Council (FSCC) noted in their 2017 Financial Stability Report in 2018 that: "Banks face marked-to-market (MtM) losses from rising interest rates. Higher market rates affect trading since existing holders of tradable securities are taking MtM losses as a result. While some banks have resorted to reclassifying their available-for-sale (AFS) securities into held-to-maturity (HTM), some PHP845.8 billion in AFS (as of end-March 2018) are still subject to MtMlosses. Furthermore, the shift to HTM would take away market liquidity since these securities could no longer be traded prior to their maturity" (bold mine) 

Curiously, discussions of HTM risks vanished from BSP-FSCC Financial Stability Reports after the 2017 and 2018 H1–2019 H1 issues.

VII. Moral Hazard and the "COVID Bailout Playbook"

Although NCoCG has been growing since 2015, banks accelerated their accumulation of government securities as part of the BSP’s 2020 pandemic rescue package. 

Are banks aggressively lending to generate liquidity solely to finance the government? Are they also using government debt to expand the collateral universe for increased lending? Government debt is also used as collateral for interbank loans and repo transactions. 

Have accounting regulations—such as HTM—transformed into a silo that shields Mark-to-Market losses? 

The growth of HTM has aligned with NCoCG. (Figure 6, lowest chart)

While this may satisfy Basel capital adequacy requirements, ironically, it also exposes the banking system to investment concentration risk, sovereign risk, and liquidity risk.

This suggests that reported bank "profits"—likely inflated by subsidies and relief measures—are overshadowed by a toxic mix of trading losses, HTM burdens, and potentially undeclared or hidden NPLs

These pressures have likely forced the BSP to aggressively cut RRR rates.

As anticipated, authorities appear poised to replicate the COVID-era bailout playbook, which they view as a success in averting a crisis.

The likely policy trajectory template includes DIRECT BSP infusions via NCoCG, record fiscal deficits, further RRR and policy rate cuts, accelerated bank infusions NCoCG, a higher cap on the USD/PHP exchange rate, and additional subsidies and relief measures for banks.

This is unfolding before us, one step at a time.

VIII. The Bigger Picture: Are We Headed for a Full-Blown Crisis?

Given the moral hazard embedded in this bailout mindset, banks may take on excessive risks, exacerbating "frictions in financial intermediation". Debt will beget more unproductive debt. "Ponzi finance" risks will intensify heightening liquidity constraints that could escalate into a full-blown crisis. 

Further, given the banking system’s fractional reserve operating framework, riskier bank behavior, whetted by reduced cash buffers, heightens the risks of lower consumer confidence in the banking system—which translates to a higher risk of a bank run

The Philippine Deposit Insurance Corporation (PDIC) reportedly has funds to cover 18.5% of insured deposits, or P3.53 trillion, as of 2023. 

So, with the RRR cuts, is the BSP gambling with this?

IX. Conclusion: RRR Cuts a High-Risk Strategy?

BSP’s statistics cannot be fully relied upon to assess the true health of the banking system.

1. The decline in non-performing loans (NPLs) is inconsistent with slowing economic growth and the deflationary spiral in the real estate sector. Likewise, falling NPLs contradict the ongoing liquidity pressures faced by banks.

2. Evidence of these liquidity strains is clear: bank borrowings have surged to record levels, with bill issuances dominating the market. The BSP’s RRR cuts only reinforce the mounting liquidity constraints. 

3. Beyond lending, banks have turned to investments to strengthen their balance sheets—including supporting the Philippine Stock Exchange (PSE), even as asset prices have become increasingly misaligned with corporate earnings.

4. In a bid to further boost systemic liquidity, implied quantitative easing (QE) spiked to an all-time high in December, which will likely translate into a higher volume of Held-to-Maturity (HTM) assets.

Through aggressive RRR cuts, is the BSP taking a high-risk approach merely to uphold its statistical narrative?


Sunday, February 16, 2025

Philippine Uni-Comm Bank Lending in 2024: Why Milestone Bank Credit Expansion and Systemic Leveraging Extrapolates to Mounting Systemic Fragility


Credit Expansion No Substitute for Capital. These opinions are passionately rejected by the union bosses and their followers among politicians and the self-styled intellectuals. The panacea they recommend to fight unemployment is credit expansion and inflation, euphemistically called an "easy money policy"—Ludwig von Mises 

In this issue

Philippine Uni-Comm Bank Lending in 2024: Why Milestone Bank Credit Expansion and Systemic Leveraging Extrapolates to Mounting Systemic Fragility

I. Challenging the BSP’s Easing Cycle Narrative

II. How BSP’s Credit Card Subsidies Materially Transformed Banking Business Model

III. Bank Lending to Real Estate Expanded in 2024, Even as Sector’s GDP Slumped to All-Time Lows!

IV. Credit Intensity Hits Second-Highest Levels!

V. Redux: The Debt-to-GDP Myth: A Background

VI. The GDP is Mostly About Debt: 2024 Public Debt-to-GDP Reaches Second Highest Level Since 2005!

VII. The Mirage of Labor Productivity

VIII. Conclusion 

Philippine Uni-Comm Bank Lending in 2024: Why Milestone Bank Credit Expansion and Systemic Leveraging Extrapolates to Mounting Systemic Fragility 

Universal-commercial bank lending performance in 2024 provides some critical insights. Combined with public debt and GDP, these reveal rising financial and economic fragilities. 

I. Challenging the BSP’s Easing Cycle Narrative 

Inquirer.net, February 13, 2025: "Bank lending posted its fastest growth in two years to cross the P13-trillion mark in December, as the start of the interest rate-cutting cycle and the typical surge in economic activities during the holiday season boosted both consumer and business demand for loans. Latest data from the Bangko Sentral ng Pilipinas (BSP) showed that outstanding loans of big banks, excluding their lending with each other, expanded by 12.2 percent year-on-year to P13.14 trillion in the final month of 2024, beating the 11.1-percent growth in November. That was the briskest pace of credit growth since December 2022." 

While the BSP kept its policy rate unchanged this week, it has engaged in an 'easing cycle' following three rate cuts, a substantial RRR reduction, and possibly record government spending in 2024.


Figure 1

The notion that the BSP's easing cycle has driven bank lending growth is not supported by the data. While December saw the "briskest...since December 2022," the 13.54% growth rate in that earlier period occurred near the peak of a hiking cycle, suggesting that neither rate hikes nor cuts significantly influence growth rates.

Official rates peaked in October 2023, ten months after the December 2022 lending surge.

II. How BSP’s Credit Card Subsidies Materially Transformed Banking Business Model 

Unlike the BSP's 2018 interest rate cycle, where hikes coincided with falling bank lending rates, the current credit market anomalies likely reflect distortions caused by the BSP's pandemic-era policies. These included an interest rate cap on credit cards and various relief measures. (Figure 1, topmost image)

Specifically, the BSP's interest rate cap in September 2020 significantly reshaped or transformed the banking system's business model, demonstrably shifting focus from business to consumer loans. 

The consumer share of universal-commercial (UC) bank loans surged by 27.4% over four years, increasing from 9.5% in 2020 to 12.1% in 2024. (Figure 1, middle window)

The biggest segment growth came from credit cards and salary loans:

-Credit card loans grew at a 22.3% CAGR from 2020 to 2024, increasing their share from 4.6% to 7.1% of total loans. Since 2018, their share has more than doubled from 3.4% to 7.1%. (Figure 1, lowest graph)

-Salary loans grew at an 18.07% CAGR over the same period, expanding their share from 0.9% to 1.2%.


Figure 2

-December's month-on-month (MoM) growth of 3.38% marked the highest since January 2022's 3.98%. Contrary to the assumption of seasonality, the highest monthly growth rates have not been confined to the holiday season. (Figure 2, topmost diagram) 

This astronomical growth in consumer credit, further fueled by December's reaccelerationunderscores the substantial leveraging of household balance sheets.  

III. Bank Lending to Real Estate Expanded in 2024, Even as Sector’s GDP Slumped to All-Time Lows! 

In 2024, real estate (Php 222.72 billion) and credit cards (Php 212.1 billion) saw the largest nominal increases in lending. Electricity and Gas, and trade, followed. (Figure 2, middle chart) 

Supply-side real estate loans accounted for 20.5% of total UC bank loans at year-end. This figure excludes consumer mortgage borrowing. 

However, while real estate's GDP share hit an all-time low of 5.4% in 2024, bank exposure to the sector reached its second-highest level. In Q3, BSP data revealed that real estate prices had entered deflationary territory. (Figure 2, lowest pane) 

The continued decline in the sector's GDP raises mounting risks for banks

Rising real estate loan growth does not necessarily indicate expansion but rather refinancing efforts or liquidity injections to prevent a surge in delinquencies and non-performing loans.


Figure 3

Moreover, key sectors benefiting from BSP’s rate policies—construction, trade, finance, and real estate—continue to represent a significant share of UC bank portfolios, which share of the GDP has also been rising, posing as systemic risk concerns. (Figure 3, topmost chart) 

IV. Credit Intensity Hits Second-Highest Levels!

A broader perspective reveals more concerning trends.

UC total bank loans grew by 10.8% year-on-year, from Php 11.392 trillion in 2023 to Php 12.81 trillion in 2024 (a net increase of Php 1.42 trillion). In comparison, nominal GDP grew by 8.7%, from Php 24.32 trillion to Php 26.44 trillion (a net increase of Php 2.12 trillion).

This gives a 'credit intensity' of Php 0.67—the amount of bank lending needed to generate one peso of GDP—the highest since 2019. This means UC bank lending has recovered to pre-pandemic levels, while GDP hasn't. 

Factoring in public debt (excluding guarantees), 2024 saw a sharp rise in credit dependency. Credit intensity from systemic debt (public debt + bank lending, excluding capital markets and shadow banking) reached its second-highest level ever, trailing only the peak of 2021. 

It now takes Php 1.35 of debt to generate one peso of GDP, highlighting diminishing returns of a debt-driven economy. (Figure 3, middle image) 

The mainstream thinks debt is a free lunch! 

V. Redux: The Debt-to-GDP Myth: A Background

The BSP’s trickle-down policies operate under an architectural framework called "inflation targeting."

Though its stated goal is to 'promote price stability conducive to balanced and sustainable growth of the economy,' it assumes that inflation can be contained or that the inflation genie can be kept under control.

Its easy money regime has been designed as an invisible tax or a form of financial repression—primarily to fund political boondoggles—by unleashing "animal spirits" through the stimulation of "aggregate demand" or GDP. At the same time, GDP growth is expected to increase tax collections. 

The fundamental problem is that the BSP has no control over the distribution of credit expansion within the economy. 

As it happened, while the "liberalized" consumer-related sectors were the primary beneficiaries, distortions accumulated—principally as the elites took advantage of cheap credit to pursue "build-it-and-they-will-come" projects

The result was the consolidation of firms within industries and the buildup of concentration risk. Soon, the cheap money landscape fueled the government’s appetite for greater control over the economy through deficit spending

Thus, the "debt-to-GDP" metric became the primary justification for expanding government spending and increasing economic centralization.

This race toward centralization through deficit spending intensified alongside the elite’s "build-it-and-they-will-come" projects during the pandemic.

VI. The GDP is Mostly About Debt: 2024 Public Debt-to-GDP Reaches Second Highest Level Since 2005!

Once again, the consensus has a fetish for interpreting debt-to-GDP as if it were an isolated or standalone factor. It isn’t.

In the recent past, they cited falling debt-to-GDP as a positive indicator. However, let’s clarify: since the economy is interconnected—one dynamic entwined with another, operating within a lattice of interrelated nodes—such a simplistic view is misleading.

When the BSP forced down rates to reinforce its "trickle-down" policies, the consequences extended beyond public spending, affecting overall credit conditions. This policy catalyzed a boom-bust cycle. 

As such, when the public debt-to-GDP declined between 2009 and 2019, it was primarily because bank credit-to-GDP filled most of the gap. 

The proof of the pudding is in the eating: systemic leverage-to-GDP remained range-bound throughout that decadeDebt was merely transferred or juggled from the public to the private sector. 

GDP growth, in large part, was debt-driven.

Yet, the pandemic-era bailout fueled a surge in both public debt-to-GDP and bank credit-to-GDP. Public debt-to-GDP (excluding guarantees) reached 60.72%—its second-highest level after 2022—following the BSP’s COVID-era bailout, which also marked the highest rate since 2005. 

It’s worth remembering that Thailand—the epicenter of the 1997-98 Asian Crisis—had the lowest debt-to-GDP at the time. (Figure 3, lowest table) 

More importantly, public debt has anchored government spending, which has played a crucial role in shaping Philippine GDP since 2016.

V. Systemic Leverage Soars to All-Time Highs! 


Figure 4

On a per capita basis, 2024 debt reached historic highs, increasing its share of per capita GDP (both in nominal and real terms). (Figure 4, topmost visual)

Simply put, rising debt levels have been eroding whatever residual productivity gains are left from the GDP. 

Alternatively, this serves as further proof that GDP is increasingly driven by debt at the expense of productivity. 

It also implies that the deepening exposure of output to credit is highlighting its mounting credit risk profile. 

In 2024, UC bank loans-to-GDP hit 48.5%, the second-highest since 2020 (49.7%), indicating crisis lending via easy money policies. 

Systemic leverage reached a record 109.2% of GDP, surpassing 2022 ATH. (Figure 4, middle chart) 

Despite a Q4 2024 liquidity spike (M3), consumers struggled; household GDP slowed, suggesting households are absorbing increasing leverage while enduring the erosion of purchasing power in the face of inflation. (Figure 4, lowest diagram)


Figure 5

Another point: The growth rate of systemic leverage has shown a strong correlation with the CPI since 2013. However, it appears to have deviated, as rising systemic leverage has yet to result in an accompanying increase in the CPI. Will this correlation hold? (Figure 5, topmost image) 

VI BSP’s ‘Trickle-Down Policies’ Steered a Credit Card and Salary Loans Boom (and coming Bust)

There is more to consider. The banking model's transformation toward consumers didn’t happen overnight; it was the result of cumulative easy money policies that intensified during the pandemic. 

Our central premise: while bank expansion fueled inflation, the pandemic-induced recession—marked by income loss—and, most notably, the BSP’s easy money emergency response (including historic interest rate and RRR cuts, various relief measures such as credit card subsidies, the USDPHP cap, and the unprecedented Php 2.3 billion BSP injections) sparked a consumer credit boom, which subsequently triggered the second wave of this inflation cycle. 

Though the BSP’s intent may have been to compensate for consumers' income losses in order to stabilize or protect the banking system, the economic reopening further stirred up consumers’ appetite for credit, fueling demand amid a recovering, fractured, and impaired supply chain. 

Debt-financed government spending also contributed to the surge in aggregate demand. Together, these factors spurred a rise in "too much money chasing too few goods" inflation. 

The inflation genie was unleashed—yet it was conveniently blamed by everyone on the "supply side." The underlying premise of the echo chamber was that the demand-supply curve had been broken!  Yet, they avoided addressing the question: How could a general price increase occur if the money supply remained stable? 

Ironically, the BSP calibrated its response to the inflation cycle by adjusting interest rates in line with its own interest rate cycle! In other words, they blamed supply-side issues while focusing their policies on demand. Remarkable! 

The BSP’s UC bank credit card and salary loan data provide evidence for all of this (Figure 5 middle and lowest graphs): the escalating buildup of household balance sheets in response to the loss of purchasing power, the CPI cycle, and the BSP and National Government’s free money policies.


Figure 6

It’s also no surprise that the oscillation of UC bank loan growth has mirrored fluctuations in the PSEi 30. (Figure 6, topmost window) 

Unfortunately, the law of diminishing returns has plagued the massive growth of consumer credit, leading to its divergence from consumer spending and PSEi 30 flows

As an aside, the upward spiral in cash in circulation last December and Q4 —reflecting both liquidity injections for the real estate industry and pre-mid-term election spending—likely points to higher inflation and the further erosion of consumer spending power. (Figure 6, middle chart) 

Is it any wonder that self-reported poverty ratings and hunger have surged to record highs? 

Does the path to 'middle-income status' for an economy translate into a population drowning in debt? 

VII. The Mirage of Labor Productivity

Businessworld, February 10, 2025: The country’s labor productivity — as measured by gross domestic product per person employed — grew by 4.5% year on year to P456,342 in 2024. This was faster than the 2.7% a year earlier and the fastest in seven years or since the 8.7% in 2017. (Figure 6, lowest image)

While this suggests improving efficiency, it fails to account for GDP’s deepening dependence on credit expansion. When growth is primarily debt-financed, productivity gains become illusory

Credit isn’t neutral. Its removal would cause the 'debt-driven GDP-labor productivity' 'castle in the sand' to crumble 

VIII. Conclusion  

The 2024 UC bank lending data reveals critical economic trends: 

>A structural shift in the banking business model, driven by the BSP’s inflation-targeting and pandemic rescue policies. 

>Mounting concentration risks due to industry consolidations and growing sector fragility.

>Public debt-to-GDP reaching its second-highest level since 2005, while systemic leverage has hit an all-time high.

Diminishing returns from the increasing dependence on systemic credit—bank expansion and public debt—highlighting the risks of financial and economic vulnerabilities and instability.

The Philippine political economy operates with a very thin or narrow margin for error.

In an upcoming issue, we are likely to address the banking system's 2024 income statement and balance sheets.