Monday, March 10, 2025

Philippine Treasury Markets vs. the Government’s February 2.1% Inflation Narrative: Who’s Right?


Inflation is a tax. Money for the government. A tax that people don’t see as a tax. That’s the best kind, for politicians—Lionel Shriver 

In this issue

Philippine Treasury Markets vs. the Government’s February 2.1% Inflation Narrative: Who’s Right?

I. February Inflation: A "Positive Surprise" or Statistical Mirage?

II. Demand Paradox: Near Full-Employment and Record Credit Highs in the face of Falling CPI and GDP?

III. The Financial Black Hole: Where Is Bank Credit Expansion Flowing?

IV. The USDPHP Cap: A Hidden CPI Subsidy

V. Markets versus Government Statistics: Philippine Treasury Markets Diverge from the CPI Data 

Philippine Treasury Markets vs. the Government’s February 2.1% Inflation Narrative: Who’s Right? 

With price controls driving February CPI down to 2.1%, the BSP’s easing narrative gains traction—yet treasury markets remain deeply skeptical

I. February Inflation: A "Positive Surprise" or Statistical Mirage?

ABS-CBN News, March 5: Inflation eased to 2.1 percent in February because of slower price increases in food and non-alcoholic beverages, among others, the Philippine Statistics Authority said Wednesday. In a press briefing, the PSA said food inflation slowed to 2.6 percent in February from 3.8 percent in January. The state statistics bureau noted that rice inflation further slowed to -4.9 percent from -2.3 percent in January…But the PSA noted that pork prices jumped by 12.1 percent in February, while the price of chicken meat leapt by 10.8 percent.  The cost of passenger transport by sea also soared to 56.2 percent in February.  Del Prado said the African swine fever problem continue to hurt pork prices in the Philippines. She said, however, that the Department of Agriculture’s plan to impose a maximum suggested retail price on pork may help ease price hikes. 

The Philippine government recently announced that inflation unexpectedly dropped to 2.1% in February 2025. One official media outlet hailed it a "positive surprise" in its headline. 

But is this optimism warranted? 

While the Philippine Stock Exchange (PSE)—via the "national team"—welcomed this news, interpreting it as a sign that the Bangko Sentral ng Pilipinas (BSP) could continue its loose monetary policy—essentially providing a pretext for rate cuts—the more critical Philippine treasury markets, which serve as indicators of interest rate trends, appeared to hold a starkly different view. 

As an aside, the BSP’s reserve requirement ratio (RRR) cut takes effect this March 28th, adding fuel to the easing narrative. 

The odd thing is that a critical detail has been conspicuously absent from most media coverage: on February 3, 2025, authorities implemented the "Food Emergency Security" (FES) measure. 

This policy, centered on price controls—specifically Maximum Suggested Retail Prices (MSRP)—was supported by the release of government reserves. 

Consequently, February’s Consumer Price Index (CPI) reflects political intervention rather than organic market dynamics.


Figure 1

Even more telling is an overlooked trend: the year-on-year (YoY) change in the national average weighted price of rice had been declining since its peak in April 2024—well before the FES was enacted. (Figure 1, topmost graph) 

In a nutshell, the FES merely reinforced the ongoing downtrend in rice prices, serving more as an election-year tactic to demonstrate government action "we are doing something about rice prices," rather than an actual cause of the decline

Nevertheless, it won’t be long before officials pat themselves on the back and proclaim the policy a triumph. Incredible. 

But what about its future implications? 

Unlike rice, where government reserves were available to support price controls, the impending implementation of MSRP for pork products next week lacks similar supply-side support. This suggests that any price stabilization achieved will be short-lived. (Figure 1, middle chart) 

As noted in February,  

However, as history shows, the insidious effects of distortive policies surface over time. Intervention begets more intervention, as authorities scramble to manage the unintended consequences of their previous actions. Consequently, food CPI remains under pressure. (Prudent Investor, 2025)  

Nevertheless, manipulating statistics serves a political function—justifying policies through "benchmark-ism."  

Beyond food prices, which dragged down the headline CPI, core CPI also eased from 2.6% in January to 2.4% in February. 

Despite this pullback, the underlying inflation cycle appears intact. (Figure 1, lowest image) 

Government narratives consistently frame inflation as a ‘supply-side’ issue or blame it on "greedflation," yet much of their approach remains focused on demand-side management through BSP’s inflation-targeting policies. 

II. Demand Paradox: Near Full-Employment and Record Credit Highs in the face of Falling CPI and GDP? 

Authorities claim that employment rates have recently declined but remain near all-time highs. 

But how true is this?


Figure 2

The employment rate slipped from an all-time high of 96.9% in December 2024 to 95.7% in January 2025—a level previously hit in December 2023 and June 2024. (Figure 2, topmost image) 

Remarkably, despite near-full employment, the CPI continues to slide. 

Officials might argue this reflects productivity gains.  But that claim is misleading.

Consumer credit growth—driven by credit cards and supported by salary loans—has been on a record-breaking tear, rising 24.4% YoY in January 2025, marking its 28th consecutive month above 20%. (Figure 2, middle window) 

Yet, unlike the 2021-2022 period, headline CPI has weakened

Could this signal diminishing returns—mainly from refinancing? 

Beyond CPI, total Universal-Commercial (UC) bank loans have surged since Q1 2021—unfazed by official interest rate levels. (Figure 2, lowest diagram)


Figure 3

The slowing growth in salary loans seems to mirror the CPI’s decline. (Figure 3, upper pane) 

And it’s not just inflation. 

Despite an ongoing surge in Universal-Commercial (UC) bank loans since Q1 2021—regardless of official interest rate levels—weak consumption continues to weigh on GDP growth. The second half of 2024 saw GDP growth slow to just 5.2%. (Figure 3, lower chart) 

This boom coincides with record real estate vacancies, near unprecedented hunger rates, and almost milestone highs in self-reported poverty

So, where has demand gone? 

In January 2025, UC bank loans (both production and consumer) increased by 13.27% year-on-year. 

Are the government’s employment figures an accurate reflection of labor market conditions? Or, like CPI data, are they another exercise in "benchmark-ism" designed to persuade voters and depositors that the political economy remains stable? 

III. The Financial Black Hole: Where Is Bank Credit Expansion Flowing?


Figure 4 

Ironically, bank financing of the government, as reflected in Net Claims on the Central Government (NCoCG), continues to soar—up 7.4% year-on-year to PHP 5.41 trillion in January 2025, though slightly down from December 2024’s historic PHP 5.54 trillion. 

Meanwhile, since bottoming at 1.5% in April 2023, BSP currency issuance has trended upward, accelerating from May 2024 to January 2025, when it hit 11% YoY. (Figure 4, topmost graph) 

Despite this massive liquidity injection—via bank lending and government borrowing—deflationary forces persist in the CPI. 

Where is this money flowing? What "financial black hole" is absorbing the injected liquidity? 

IV. The USDPHP Cap: A Hidden CPI Subsidy 

The recent weakness of the US dollar—primarily due to a strong euro rally following U.S. President Trump’s pressure on Europe to increase NATO contributions—has driven up the region’s stock markets, particularly defense sector stocks. This, in turn, has triggered a global bond selloff.

The euro’s strength has also bolstered ASEAN currencies, including the Philippine peso. 

As predicted, the BSP’s cap on the USD-PHP exchange rate— a de facto subsidy—has fueled an increase in imports. In January, the nation’s trade deficit widened by 17% to USD 5.1 billion due to a 10.8% jump in imports. (Figure 4, middle window) 

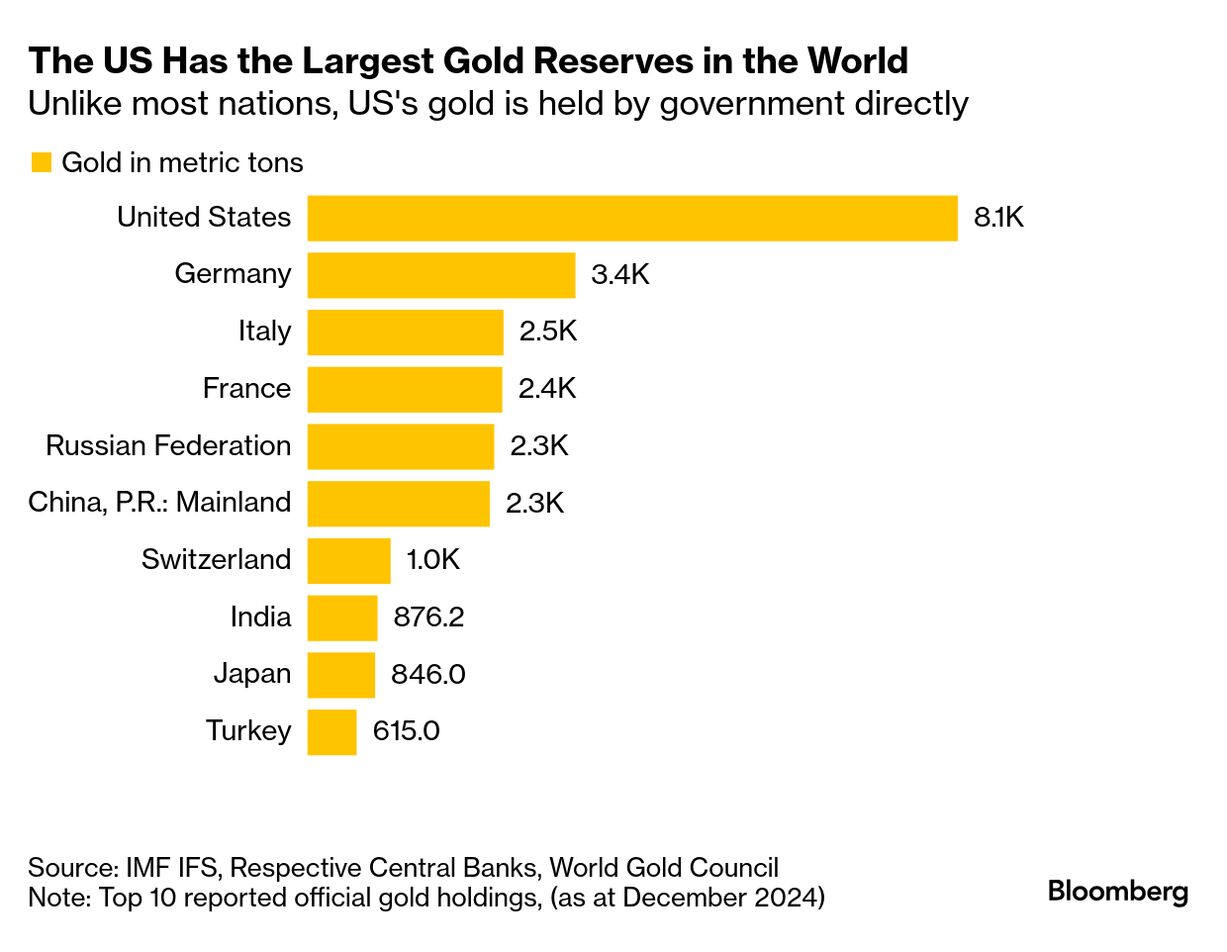
Further, to defend this cap, the BSP sold significant foreign exchange (FX) in January, only to replenish its Gross International Reserves (GIR) in February via a USD 3.3 billion bond issuance. The BSP attributes the GIR increase to "(1) national government’s (NG) net foreign currency deposits with the Bangko Sentral ng Pilipinas (BSP), which include proceeds from its issuance of ROP Global Bonds, (2) upward valuation adjustments in the BSP’s gold holdings due to the increase in the price of gold in the international market, and (3) net income from the BSP’s investments abroad." (Figure 5, lowest visual) 

This disclosure confirms the valuable role of gold in the BSP’s reserves

In short, the USD-PHP cap has not only subsidized imports but has also artificially suppressed the official CPI figures. 

From 2015 to 2022, the ebbs and flows in the USD-PHP exchange rate were strongly correlated with CPI trends.  


Figure 5

However, since 2022, when the exchange rate cap was strictly enforced, this relationship has broken down, increasing pressure on the credit-financed trade deficit and necessitating further borrowing to sustain both the cap and the Gross International Reserves (GIR). (Figure 5, topmost image) 

V. Markets versus Government Statistics: Philippine Treasury Markets Diverge from the CPI Data 

First, while global bond yields have risen amid the European selloff, this has not been the case for most ASEAN markets—except for the Philippines. This suggests that domestic factors have been the primary driver of movements in the ASEAN treasury markets, including the Philippines. (Figure 5, middle and lowest graphs)


Figure 6

Second, it is important to note that institutional traders dominate the Philippine treasury markets. This dynamic creates a distinction between the public statements of their respective "experts" and the actual trading behavior of market participants—"demonstrated preferences." 

The apparent divergence between the CPI and Philippine 10-year bond yields—despite their previous seven-year correlation—reveals disruptions caused by other influencing factors. (Figure 6, upper chart) 

Or, while analysts often serve as institutional cheerleaders for the traditional market response to an easing cycle, traders seem to be reacting differently.

Finally, further cementing this case for decoupling, the Philippine yield curve steepened (bearish steeper) during the week of the CPI announcement—suggesting that treasury markets are pricing in future inflation risks or tighter policy, potentially discounting the recent CPI decline as temporary. (Figure 6, lowest graph) 

All in all, while the government and the BSP claim to have successfully contained inflation, treasury markets remain highly skeptical—whether about the integrity of the data, the sustainability of current policies, or both. 

Our bet is on the latter.

___

References  

Prudent Investor, January 2025 2.9% CPI: Food Security Emergency andthe Vicious Cycle of Interventionism February 10, 2025


Sunday, March 09, 2025

2024’s Savings-Investment Gap Reaches Second-Widest Level as Fiscal Deficit Shrinks on Non-Tax Windfalls


Deficits add up. Debt needs to be refinanced. And the larger the cost of servicing past spending, the less is available for the present. This is inherently and obviously a crackpot way to run a nation. It guarantees chaos, inflation, defaults and poverty—Bill Bonner 

In this issue

2024’s Savings-Investment Gap Reaches Second-Widest Level as Fiscal Deficit Shrinks on Non-Tax Windfalls 

In 2024, the Philippines' Savings-Investment Gap continued to widen to a near record, driven primarily by fiscal deficit spending—its effects and potential consequences discussed in two connected articles.

A. The Widening Savings-Investment Gap: A Growing Threat to Long-Term Stability

I. The Philippines as a Poster Child of Keynesian Economic Development

II. The Persistent Decline in Savings and the Investment Boom

III. Sectoral Investment Allocation and Bank Lending Trends

IV. Bank Lending Patterns and the Role of Real Estate

V. The SI Gap and the ’Twin Deficits’

VI. Conclusion: Deepening SI Gap a Risk to Long-Term Stability

B. 2024 Fiscal Performance: Narrower Deficit Fueled by Non-Tax Windfalls, Masking Structural Risks

I. 2024 Deficit Reduction: A Superficial Improvement? Revenue Growth: The Role of Non-Tax Windfalls

II. Government Spending Trends: A Recurring Pattern; Symptoms of Centralization

III. 2024 Public Debt and Debt Servicing Costs Soared to Record Highs!

IV. Public "Investments:" Unintended Market and Economic Distortions

V. Conclusion: Current Fiscal Trajectory a Growing Risk to Financial and Economic Stability 

A. The Widening Savings-Investment Gap: A Growing Threat to Long-Term Stability

I. The Philippines as a Poster Child of Keynesian Economic Development


Figure 1

Businessworld, February 28, 2025: In 2024, the country’s savings rate — defined as gross domestic savings as a percentage of gross domestic product (GDP) — grew to 9.3%, reaching P2.47 trillion. Meanwhile, the investment rate was 23.7% of GDP, or P6.27 trillion, resulting in a P3.8-trillion gap. The savings-investment gap (S-I) gap — the difference between gross domestic savings and gross capital formation — shows a country’s ability to finance its overall investment needs. An S-I deficit occurs when a country’s investment expenditures exceed its savings, forcing borrowing to fund the gap. (Figure 1, topmost chart)

The Philippines may be considered one of the poster children of Keynesian economic development.

Given that aggregate demand serves as the foundation of the economy, national economic policies have been designed to stimulate and manage a spending-driven growth model, particularly through investment and consumption.

From a Keynesian perspective, the government is expected to compensate for any spending shortfall from the private sector by increasing its own expenditures.

The Savings-Investment Gap (SIG) serves as a key metric for tracking the evolution of aggregate demand management over time.

However, this ratio may be understated due to potential discrepancies in macroeconomic data—GDP figures may be overstated, while inflation (CPI) may be understated. Or, in my humble view, the actual savings rate may be even lower than indicated.

II. The Persistent Decline in Savings and the Investment Boom

The Philippines’ gross domestic savings rate has been in a downtrend since 1985, but it plummeted after 2018coinciding with an acceleration in government spending. This trend worsened in 2020, when the pandemic triggered a surge in public expenditures. (Figure 1, middle image) 

From 1985 onward, the persistent decline in savings suggests a rise in household consumption, a "trickle-down effect," supported by accommodative monetary policy and moderate fiscal expansion.

Meanwhile, the investment rate surged between 2016 and 2019, driven by government-led initiatives, particularly the ‘Build, Build, Build’ program.

However, the 2020 collapse—where both savings and investment rates fell sharply—highlighted the government’s aggressive "automatic stabilization" response to the pandemic recession, which relied on RECORD deficit spending and monetary stimulus.

The Bangko Sentral ng Pilipinas (BSP) introduced unprecedented measures, including ₱2.3 trillion in liquidity injections, historic reductions in reserve requirements and policy rates, a managed USDPHP cap, and various financial relief programs.

III. Sectoral Investment Allocation and Bank Lending Trends 

The distribution of investments can be inferred from sectoral GDP contributions and bank lending trends. 

As of 2024, the five largest contributors to GDP were:

-Trade (18.6%)

-Manufacturing (17.6%)

-Finance (10.6%)

-Agriculture (8%)

-Construction (7.5%) (Figure 1, lowest graph) 

However, both manufacturing and agriculture have been in decline since 2000, suggesting that investments have largely flowed into trade, finance, and construction (including government-related projects).

Real estate, once a growing sector, peaked in 2015 and has since been in decline. Nevertheless, it remained the seventh-largest sector in 2024. It trailed professional and business services—which encompasses head office activities, architectural and engineering services, management consultancy, accounting, advertising, and legal services.

The top five GDP contributors accounted for 62.25% of total output, down from 66.06% in 2020, primarily due to the contraction in manufacturing and agriculture. 

IV. Bank Lending Patterns and the Role of Real Estate


Figure 2

While the real estate sector's share of real GDP declined, its share of bank lending expanded significantly. (Figure 2, topmost window) 

From 2014, real estate-related borrowing rose sharply, peaking in 2021, before moderating below 2022 levels. Nevertheless, real estate remained the largest client of the banking system in 2024, accounting for 19.6% of total loans. (Figure 2, middle diagram) 

That is—assuming banks have reported accurate data to the BSP. The reality is that banks often lack transparency regarding loan distribution and utilization (where the money is actually spent)

Given that many retail investors (mom-and-pop borrowers) are very active in real estate, it is likely that actual exposure is understated, as banks may structure their reporting to circumvent BSP lending caps on the sector—it extended the price cap during the pandemic. 

In the meantime, the share of consumer lending has seen the most significant growth, surging after 2014 and becoming the dominant growth segment of bank credit. 

Meanwhile, the share of loans to the trade industry declined marginally, and manufacturing loans saw a steep drop—reflecting its GDP performance. 

Lending to the financial sector peaked in 2022 but has since declined, whereas credit to the utilities sector increased from 2014 to 2020 and has remained stable since. 

V. The SI Gap and the ’Twin Deficits’ 

The sharp decline in manufacturing underscores the structural imbalances reflected in the SI Gap, which in turn has contributed to the record "twin deficits" (fiscal and external trade). (Figure 2, lowest chart) 

As both consumers and the government spent beyond domestic productive capacity, the economy became increasingly reliant on imports to satisfy aggregate demand. 

Although the deficits have slightly narrowed from their pandemic peaks, they remain at ‘emergency stimulus levels’, posing risks to long-term stability. (see discussion on fiscal health below) 

These deficits have been—and will continue to be—financed through both domestic (household) and foreign (external debt) borrowing.


Figure 3
 

The widening SIG has coincided with a decline in M2 savings growth, while the M2-to-GDP ratio surged, reflecting both credit expansion and monetary stimulus (including BSP’s money printing operations). (Figure 3, upper pane) 

External debt has also reached an all-time high in 2024, adding another layer of vulnerability. 

VI. Conclusion: Deepening SI Gap a Risk to Long-Term Stability 

The Philippines' growing S-I gap and declining savings rate reflect deep-seated structural imbalances that raise concerns about long-term economic stability

A shrinking domestic savings pool limits capital accumulation, increase dependence on external financing, and expose the economy to risks such as debt distress and currency fluctuations. 

B. 2024 Fiscal Performance: Narrower Deficit Fueled by Non-Tax Windfalls, Masking Structural Risks 

I. 2024 Deficit Reduction: A Superficial Improvement? Revenue Growth: The Role of Non-Tax Windfalls 

Inquirer.net, February 28: "The Marcos administration posted a smaller budget shortfall in 2024, but it was not enough to contain the deficit within the government’s limit as unexpected expenses pushed up total state spending. Latest data from the Bureau of the Treasury (BTr) showed that the budget gap had dipped by 0.38 percent to around P1.51 trillion last year. As a share of gross domestic product (GDP), the deficit improved to 5.7 percent last year, from 6.22 percent in 2023. But it still indicated that the government had spent beyond its means, requiring more borrowings that pushed the state’s outstanding debt load to P16.05 trillion by the end of 2024." (bold added)

Now, let us examine the performance of the so-called "public investment" in 2024.

Officials hailed the alleged improvement in the fiscal balance. One remarked"This is the lowest since 2020 and shows the good work of the administration's economic team."

Another noted that "the drop in the deficit was ‘better than expected,’" implying that "the government no longer needs to borrow as much if the budget deficit is shrinking."

From my perspective, manipulating popular benchmarks—whether through statistical adjustments or market prices—as a form of political signaling to sway depositors and voters—is what I call "benchmark-ism."

While both spending and revenues hit their respective milestones, the 2024 fiscal deficit only decreased marginally from Php 1.512 trillion to Php 1.51 trillion. (Figure 3, lower image)

The so-called "improvement" mainly resulted from a decline in the deficit-to-GDP ratio, which fell from 6.22% in 2023 to 5.7% in 2024—a reduction driven largely by nominal GDP growth rather than actual fiscal restraint.

Authorities credit this "improvement" primarily to revenue growth.

While it's true that fiscal stimulus led to a broad-based increase in revenues, officials either deliberately downplayed or diverted attention from the underlying reality.


Figure 4

Despite record bank credit expansion in 2024, tax revenue only increased 10.8%, driven by the Bureau of Internal Revenue’s (BIR) modest 13.3% growth and the Bureau of Customs’ (BoC) paltry 3.8% rise. Instead, the real driver of revenue growth was an extraordinary 56.9% surge in NON-tax revenues, which pushed total public revenues up 15.56%. (Figure 4, middle image) 

As a result, the share of non-tax revenues spiked from 10.3% in 2023 to 14% in 2024—its highest level since 2007’s 17.9%! (Figure 4, topmost diagram) 

The details or the nitty gritty tell an even more revealing story. According to the Bureau of Treasury (February 27): "Total revenue from other offices (other non-tax, including privatization proceeds, fees and charges, grants, and fund balance transfers) doubled to PHP 335.0 billion from PHP 167.2 billion a year ago and exceeded the P262.6 billion revised program by 27.56% (PHP 72.4 billion) primarily due to one-off remittances." (bold added)

To emphasize: ONE-OFF remittances!

Revenues from "Other Offices" doubled in 2024, with its share jumping from 4.4% to 7.6%.

If this one-time windfall hadn’t occurred, the fiscal deficit would have exploded to a new record of Php 1.84 trillion! 

Despite the minor deficit reduction, public debt still surged. 

Public debt rose by 9.82% YoY (Php 1.435 trillion) in 2024—higher than 8.92% (Php 1.2 trillion) in 2023. (Figure 4, lowest graph) 

Was the increased borrowing in 2024 a response to cosmetically reducing the fiscal deficit? 

And that’s not all.

II. Government Spending Trends: A Recurring Pattern; Symptoms of Centralization


Figure 5

For the sixth consecutive year, the government exceeded the ‘enacted budget’ passed by Congress. The Php 157 billion overrun in 2024 was the largest since the post-pandemic recession in 2021, when the government implemented its most aggressive fiscal-monetary stimulus package. (Figure 5, topmost chart)

More importantly, this repeated breach of the "enacted budget" signals a growing shift of fiscal power from Congress to the executive branch.

Looking ahead, 2025’s enacted budget of Php 6.326 trillion represents a 9.7% increase from 2024’s Php 5.768 trillion.

The seemingly perpetual spending growth has been justified on the assumption of delivering projected GDP growth. 

While some "experts" claim the Philippines is becoming more ’business-friendly,’ the growing expenditure-to-GDP ratio tells a different story:

-The government is increasingly centralizing control over economic resources.

-This trend began in 2014, accelerated in 2016, and peaked in 2021 at 24.1%—the first breach of the enacted budget. After marginally declining to 21.94% in 2023, it rebounded to 22.4% in 2024. (Figure 5, middle image)

However, these figures only account for public spending. When factoring in private sector funds allocated to government projects, the true extent of government influence could easily exceed 30% of economic activity.

Of course, this doesn’t come for free. Government spending is funded through taxation, borrowing, and inflation. 

The more the government "invests," the fewer resources remain for private sector growth—the crowding out effect. 

This spending-driven economic model has distorted production and price structures, evident in: 

-The persistent "twin deficits"

-A second wave of inflation (Figure 5, lowest visual) 

III. 2024 Public Debt and Debt Servicing Costs Soared to Record Highs!


Figure 6

And surging public debt is just one of the consequences of crowding out the private sector. 

Public debt-to-GDP rose from 60.1% in 2023 to 60.7% in 2024—matching 2005 levels. (Figure 6, topmost diagram) 

More strikingly, debt service (interest + amortization) as a share of GDP surged from 6.6% in 2023 to 7.6% in 2024—its highest since 2011.

In fact, both debt-to-GDP and debt service-to-GDP in 2024 exceeded pre-Asian Crisis levels (1996-1997). 

Rising debt service costs imply that: 

1 Government spending will increasingly be diverted toward debt payments or rising debt service costs constrain fiscal flexibility, leaving fewer resources for essential public investments

2 Revenues will suffer diminishing returns as debt servicing costs spiral (Figure 6 middle window)

Growing risks of inflation (financial repression or the inflation tax)—as government responds with printing money

Mounting pressures for taxes to increase 

The principal enabler of this debt buildup has been the BSP’s prolonged easy money regime. (Figure 6, lowest chart)


Figure 7

The banking system has benefited from extraordinary BSP political support, including: Official rate and RRR cuts, liquidity injections, USDPHP cap and various subsidies and relief measures 

The industry has also functioned as a primary financier of government debt via net claims on central government or NCoCG), with banks acquiring government debt—reaching an all-time high in 2024. (Figure 7, topmost window)

IV. Public "Investments:" Unintended Market and Economic Distortions

This policy stance of propping up the banking system comes with unintended consequences. 

Bank liquidity has steadily declined—the cash-to-deposit ratio has weakened since 2013, mirroring the rising deficit-to-GDP ratio. (Figure 7, middle graph) 

Market distortions are also evident in declining stock market transactions and the PSEi 30’s prolonged bear market—despite interventions by the so-called "National Team." (Figure 7, lowest chart)

V. Conclusion: Current Fiscal Trajectory a Growing Risk to Financial and Economic Stability 

So, what’s the bottom line? 

Government "investment" is, in reality, consumption. 

It has fueled economic distortions, malinvestment, and ballooning public debt—ultimately crowding out private sector investment and jeopardizing fiscal sustainability. 

Political "free lunches" remain popular, not only among the public but also within the “intelligentsia” class or the intellectual cheerleaders of the government.

As we warned last December: 

"Any steep economic slowdown or recession would likely compel the government to increase spending, potentially driving the deficit to record levels or beyond. 

Unless deliberate efforts are made to curb spending growth, the government’s ongoing centralization of the economy will continue to escalate the risk of a fiscal blowout. 

Despite the mainstream's Pollyannaish narrative, the current trajectory presents significant challenges to long-term fiscal stability." (Prudent Investor 2024)

 ___

References: 

Prudent Investor, Debt-Financed Stimulus Forever? The Philippine Government’s Relentless Pursuit of "Upper Middle-Income" Status December 1, 2025


Monday, March 03, 2025

BSP’s Gold Reserves Policy: A Precursor to a Higher USD-PHP Exchange Rate?


Central banks and finance ministries do not hold copper, aluminum, or steel supplies, yet they hold gold. The only explanation for central bank gold hoards is the obvious one - gold is money― James Rickards

In this issue 

BSP’s Gold Reserves Policy: A Precursor to a Higher USD-PHP Exchange Rate?

I. BSP’s Contradicting Official Statements

II. Why the Rhetorical Shift? World’s Largest Gold Seller in 2024—BSP

III. BSP’s Gold Sales: Supporting the USD-PHP Soft Peg

IV. Other Reserve Assets (ORA) and Financial Derivatives: Did the BSP Short Gold?

V. Broader Economic Pressures: 11-Year High January Balance of Payments (BoP) Deficit and Soaring External Debt

VI. Signaling Channel: The BSP’s Softening Rhetorical Stance on the USDPHP Cap

VII. Conclusion: Inevitable Devaluation of the Philippine Peso? 

BSP’s Gold Reserves Policy: A Precursor to a Higher USD-PHP Exchange Rate? 

The BSP’s gold reserves have been shrinking since 2020, ultimately contributing to the devaluation of the Philippine peso. The BSP sold the most gold in 2024—how low will the peso fall? 

I. BSP’s Contradicting Official Statements 

So, the BSP’s caught up in the wild storm of election season, and guess what? They’re back at it, defending their whole deal with gold reserves. 

BSP, February 24: "The country’s GIR is not used for any other purpose other than meeting the country’s forex requirements. Tasked to manage the country’s external accounts, among other functions, the BSP has been buying and selling gold over the years as part of its core functions. When the BSP sells gold, the proceeds revert to and stay within the GIR. Last year, the GIR rose to USD 106.3 billion from USD 103.8 billion in 2023. Similar to other central banks, the BSP maintains a portion of its reserves in gold as part of the country’s GIR mostly to hedge against/offset movements in the market price of other assets. It buys or sells gold to maintain an optimum level for this purpose, not too much, not too little. This follows basic portfolio-management principles. Gold prices tend to move in the opposite direction of other assets. Therefore central banks hold some gold as a hedge against price declines in other assets in the reserves. However gold prices can be volatile, earns little interest, and has storage costs, so central banks don’t want to hold too much." (bold added) 

Back in September, after basking in the limelight, the BSP defended its decision to sell gold.

BSP, September 24, 2024: "The Bangko Sentral ng Pilipinas (BSP) sold gold during the first half of the year as part of its active management strategy of the country’s gold reserves, which form part of the country’s Gross International Reserves (GIR). The BSP took advantage of the higher prices of gold in the market and generated additional income without compromising the primary objectives for holding gold, which are insurance and safety." (bold added) 

There is a stark shift in the BSP’s stance on gold reserves. Earlier, they described gold as essential for "insurance and safety," yet last month they’ve characterized it as a "dead asset" that "earns little interest and has storage costs." 

II. Why the Rhetorical Shift? World’s Largest Gold Seller in 2024—BSP


Figure 1

The World Gold Council (WGC) noted that the BSP "confirmed its gold sales—totaling 30 tonnes"—the largest sale by a central bank in 2024. (Figure 1, upper image)

While some other central banks also sold gold, their sales were on a significantly smaller scale.

Globally, central banks were net buyers in 2024, particularly emerging market central banks. The WGC reported that "Central banks added 1,045 tonnes to global gold reserves in 2024."

Since the 2008 financial crisis, global central banks have been rebuilding reserves. (Figure 1, lower pane)


Figure 2

Notably, China’s PBOC and the Central Bank of India were among the most aggressive buyers—not just in 2024, but for several years. (Figure 2, upper window)

Alongside Russia, their gold holdings have matched or even exceeded those of some developed nations, closing the gap with the US. (Figure 2, lower chart—excludes unpublished holdings)

Given this trend, BSP’s claim that "central banks don’t want to hold too much" appears misleading—an appeal to the false majority (argumentum ad populum).

It seems more like an attempt to justify its selling spree rather than reflect actual central bank behavior globally.

III. BSP’s Gold Sales: Supporting the USD-PHP Soft Peg

As part of its "active management strategy," the BSP has been selling gold to finance the USD-PHP soft peg, capping the exchange rate at 59 per USD. This is not just about portfolio rebalancing—it’s a deliberate move to influence the USDPHP exchange rate. 

But that’s not the whole story.

There are costs to this approach. Central banks are political institutions and are not driven by profit-and-loss activities. When the BSP came under scrutiny for its aggressive selling, not only did they stop, but they also started repurchasing gold in August—at much higher prices. In essence, they sold high but bought higher, leading to opportunity losses.


Figure 3

Despite recent incremental purchases, BSP’s gold reserves remain at their lowest level since at least 2019, according to BSP and IMF’s data template on International Reserves and Foreign Currency Liquidity (IRIFCL) data. 

Data further highlights historical trends, including BSP’s two waves of gold sales. (Figure 3, topmost graph) 

First Wave (2020-2021 Pandemic Recession): BSP sold gold even as the USD-PHP was weakening. This suggests it anticipated the pesos’ depreciation. 

Second Wave (Nov 2023 - July 2024): Gold sales preceded another test of the USD-PHP 59 level in June 2024, implying an effort to manage exchange rate volatility. 

Despite record-high gold prices, BSP’s overall reserves increased due to valuation gains rather than inventory growth. (Figure 3, middle diagram) 

In any case, the all-time high in gold prices has led to an increase in gold’s share of the GIR, reaching 2020 levels. (Figure 3, lowest image) 

On the other hand, the BSP’s demonstrated preference for gold sales reveals its dogmatic proclivities, which barely acknowledges gold as a function of ‘insurance and safety.’ 

Still, despite a reduction in inventory, the BSP owes a significant share of its GIR to gold prices. 

IV. Other Reserve Assets (ORA) and Financial Derivatives: Did the BSP Short Gold? 


Figure 4

Beyond public external borrowings, (Figure 4, topmost graph) which bolster the GIR through National Government deposits with the BSP, Other Reserve Assets (ORA) have played a prominent role since 2018. 

ORA has been rising since January 2024, when the BSP accelerated its gold sales. (Figure 4, middle window) 

ORA has played a conspicuous role in the USDPHP. Its surge from 2018 to 2020 coincided with the fall of the USDPHP, and vice versa (Figure 4, lowest chart) 

ORA includes: 

-Mark-to-market financial derivatives (forwards, futures, swaps, options)

-Forwards and options on gold

-Short-term foreign currency loans

-Other financial assets used for immediate liquidity

-Repo assets 

This raises key questions: 

-Has BSP been ‘shorting’ gold via ORA while conducting physical sales to settle delivery? 

-Is BSP boosting its reserves with derivatives and repos via transactions with international financial intermediaries, particularly US-based institutions? 

While the BSP claims that gold "earns little interest and has storage costs," financial derivatives also incur commissions and fees, which are paid to banks, brokers, and dealers. These costs include premiums on options and other transaction fees. 

-Why has the BSP been prioritizing financial derivatives and repos over gold, which serves as "insurance and safety"? Are these instruments not costlier and riskier? 

-Has geopolitics influenced the BSP’s decision-making trade-offs? Aside from its geopolitical alignment with the U.S., could this shift toward Wall Street-linked instruments be connected to the Philippines' removal from the FATF’s money laundering grey list? 

To sum up, has the BSP’s increasing use of financial leverage to sustain the USDPHP soft peg led to diminishing returns? And is its shrinking gold stock a symptom of this trend? 

V. Broader Economic Pressures: 11-Year High January Balance of Payments (BoP) Deficit and Soaring External Debt 

Yet more symptoms. 

BSP, February 19: "The country’s overall balance of payments (BOP) position posted a deficit of US$4.1 billion in January 2025, higher than the US$740 million BOP deficit recorded in January 2024. The BOP deficit in January 2025 reflected the Bangko Sentral ng Pilipinas’ (BSP) net foreign exchange operations and drawdowns by the national government (NG) on its foreign currency deposits with the BSP to meet its external debt obligations."


Figure 5

That is, the January BoP deficit widened to an 11-year high! Ironically, the NG raised USD 3.3 billion in January. This suggests that the BOP deficit largely reflects the net cost of defending the USDPHP soft peg. Remarkable!

Additionally, Bureau of Treasury data shows that external debt in peso terms—partially reflecting devaluation—continues to surge, growing 11.4% year-over-year, with its uptrend dating back to 2012

FX debt servicing costs (interest and amortization) skyrocketed 47.5% in 2024, increasing its share of total debt to 22.9%, confirming a trend reversal in 2023.

Be reminded: This debt buildup wouldn’t have been necessary had there been sufficient organic FX revenue (e.g., remittances, tourism, service exports, FDI and etc.).

VI. Signaling Channel: The BSP’s Softening Rhetorical Stance on the USDPHP Cap

With declining gold reserves and mounting external pressures, peso devaluation appears increasingly likely.

Inquirer.net, February 15: "A peso fall to the 60-level against the US dollar remains “a possibility” despite the Bangko Sentral ng Pilipinas’ (BSP) decision to hold rates steady, Governor Eli Remolona Jr. said, adding that hitting the pause button on easing was the “less disruptive” action for the market." (bold added)

This media communication represents the "signaling channel" approach—where central bankers use public messaging to condition market expectations.

Foreign institutions have begun forecasting a breach of the 59-peso level:

Sunlife: 61

Bank of America: 60

Maybank: 63

BMI: Above 60

HSBC: Beyond 59 

These are hardly typical forecasts or implicit pressure on the BSP; rather, they seem part of the signaling effort in shaping the Overton Window. 

The USDPHP exchange rate operates under a ‘soft peg’ regime, meaning the BSP will likely determine the next upper band or ceiling. In the previous adjustment, the ceiling rose from 56.48 in 2004 to 59 in 2022, representing a 4.5% increase. If history rhymes, the next likely cap could be in the 61-62 range. 

VII. Conclusion: Inevitable Devaluation of the Philippine Peso? 

BSP’s evolving stance on gold raises fundamental questions about its broader strategy. Its aggressive sales, followed by reactive repurchases at higher prices, suggest a focus on short-term currency stabilization—driven by sensationalist politics—rather than strategic reserve management. 

At the same time, the increasing reliance on derivatives and external debt amplifies long-term financial risks. 

Moreover, the BSP appears less committed to defending the 59 level, as indicated by both its rhetoric and evolving fundamentals, including declining gold reserves. 

With external pressures mounting, peso devaluation seems not a matter of IF but WHEN.